
XRP price recovery appears fragile—can bulls break through the price ceiling?

XRP price started a rebound above $1.90. The price is currently consolidating and may find it difficult to break through the $2.00 resistance level.
- XRP price started a rebound above the $1.9050 area.
- The price is currently below $2.00 and the 100-hour simple moving average.
- A descending trend line is forming on the XRP/USD hourly chart, with resistance at $1.9520 (data source: Kraken).
- If the pair stabilizes above $2.00, it may continue to rise.
XRP Price Faces Resistance
XRP price found support above $1.850 and started a rebound, just like bitcoin and ethereum prices, successfully climbing above $1.880 and $1.90 (UTC+8), entering a short-term upward range.
The price once broke through the 23.6% Fibonacci retracement level of the decline from the $2.047 high to the $1.850 low. Bears held the $1.950 closing price, after which the price pulled back. On the XRP/USD hourly chart, a bearish trend line is forming with resistance near $1.9520.
Currently, the price is below $1.950 (UTC+8) and the 100-hour simple moving average. If a new upward move occurs, the price may face resistance near $1.950 (UTC+8) and at the trend line. This position coincides with the 50% Fibonacci retracement level of the decline from the $2.047 high to the $1.850 low.
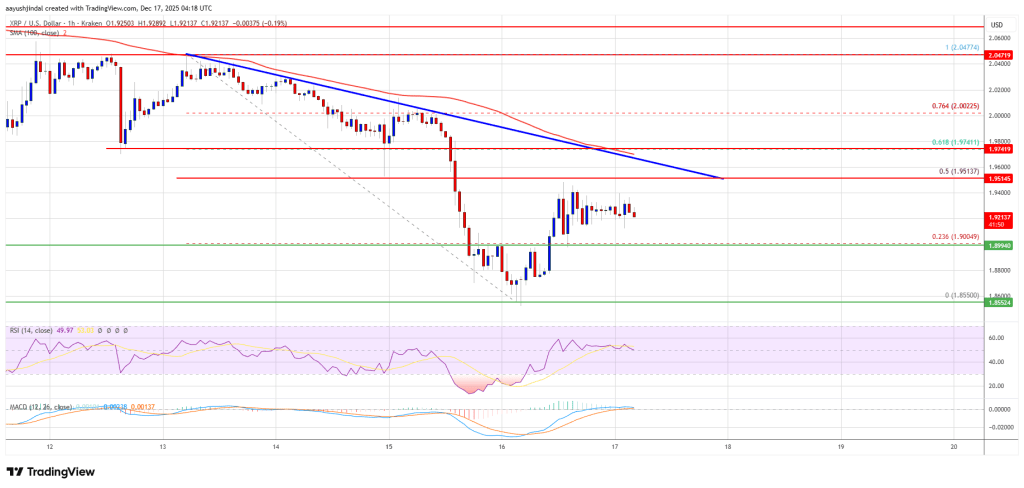 Source: XRPUSD on TradingView.com
The first major resistance is near $2.00 (UTC+8). If the closing price is above $2.00 (UTC+8), the price may rise to $2.050 (UTC+8). The next resistance is at $2.120 (UTC+8). If the price effectively breaks through the $2.120 (UTC+8) resistance, it may move toward the $2.20 (UTC+8) resistance. If the price continues to rise, it may move toward the $2.220 (UTC+8) resistance. The next major resistance for the bulls may be near $2.250 (UTC+8).
Another Wave?
If XRP fails to break through the $2.00 (UTC+8) resistance, it may start a new round of decline. The initial support on the downside is near $1.90 (UTC+8). The next major support is near $1.850 (UTC+8).
If the price falls below the $1.850 (UTC+8) level and closes below it, it may continue to drop to $1.820 (UTC+8). The next major support is near $1.80 (UTC+8), and if this support is broken, the price may continue to test $1.7650 (UTC+8).
Technical Indicators
Hourly MACD indicator — The MACD for XRP/USD is currently slowing down in the bearish zone.
Hourly Relative Strength Index (RSI) — The RSI for XRP/USD is currently above the 50 level.
Main support levels — $1.90 (UTC+8) and $1.850 (UTC+8).
Main resistance levels — $1.950 (UTC+8) and $2.00 (UTC+8).
Disclaimer: The content of this article solely reflects the author's opinion and does not represent the platform in any capacity. This article is not intended to serve as a reference for making investment decisions.
You may also like
NVIDIA (NVDA.US) management changes may affect Anthropic's IPO plans; the market is watching whether the multi-billion-dollar investment will change
With the sudden departure of Nvidia CEO Jensen Huang, the record-breaking initial public offering plan of AI giant Anthropic is being reconsidered by the market.
Nebius Q3 results exceed expectations, capital expenditure rises to $27 billion, ARR target postponed, stock falls over 14% pre-market | Earnings Report Insights
Nebius reported Q3 revenue of $981 million (a year-on-year increase of 571%) and adjusted EBITDA of $466 million, both exceeding expectations. However, the company delayed and lowered its guidance for annual recurring revenue (ARR), stating that it is no longer applicable. Additionally, it significantly raised its 2026 capital expenditure target to $27 billion, with projections to further increase to $40 billion to $45 billion in 2027. The stock price plummeted more than 14% in pre-market trading.
AUD/USD Price Forecast: Breakdown of H&S pattern keeps the pair under pressure
U.S. Stock Market Preview | Major Index Futures Mixed; Nvidia Plunges Pre-market; Fed Officials' Speeches Incoming
Before the U.S. stock market opens on Thursday, November 12, the three major U.S. stock index futures showed mixed movements.
Crypto prices
More


