
Shiba Inu Market Forecast for December 16: Is a New Wave of Shiba Inu Sell-Off Approaching?

In the past 24 hours, SHIB dropped by about 4.1%, trading around $0.000007812, with intraday prices fluctuating between $0.000007754 and $0.000008215. This range indicates that sellers attempted to push the price higher, but selling pressure forced it back down, and currently, buying interest seems closer to the lower end of the day's price range.
This movement has triggered significant market participation, with SHIB's 24-hour trading volume approaching $131.67 million. SHIB has fallen about 9% over the past week, raising the next question: is this decline forming a bottom, or is...another wave of sellingstill leading the way.
Shiba Inu Price Prediction
A closer look at the hourly chart shows SHIB still below the 7-period Smoothed Moving Average (SMMA), which is around $0.00000784. This moving average is trending downward and has acted as dynamic resistance. Until the price can close above and hold this level, any rebound will remain limited.
 Shiba Inu 1-hour chart
Momentum remains bearish, with the Chande Momentum Oscillator near -34. This indicator suggests that although recent price action has stabilized somewhat, sellers still have the upper hand. A more constructive shift would be if the indicator rises above 0, which would indicate that selling pressure is easing and buyers are beginning to regain control of the market.
Trend strength remains high, with the ADX (14) indicator near 38. The ADX itself does not indicate direction, but readings above 25 usually mean a strong trend. Since SHIB remains below the downward SMMA and momentum is negative, the ADX level supports the view that even if the market pauses temporarily, there is still strong overall downward pressure.
In terms of key price levels, SHIB's potential bottom is near $0.00000775 to $0.00000780. If this level is breached, sellers may attempt to push the price down to $0.00000770. On the upside, resistance starts at $0.00000784 (SMMA), then extends to the recent pullback area, around $0.00000790 to $0.00000793.
Shiba Inu Outflows Continue
Elsewhere,the latest SHIB futures flow datashows that traders remain cautious, with net capital outflows persisting. In the past 12 hours, SHIB futures saw $4.86 million in inflows and $5.10 million in outflows, resulting in a net outflow of about $235,800.
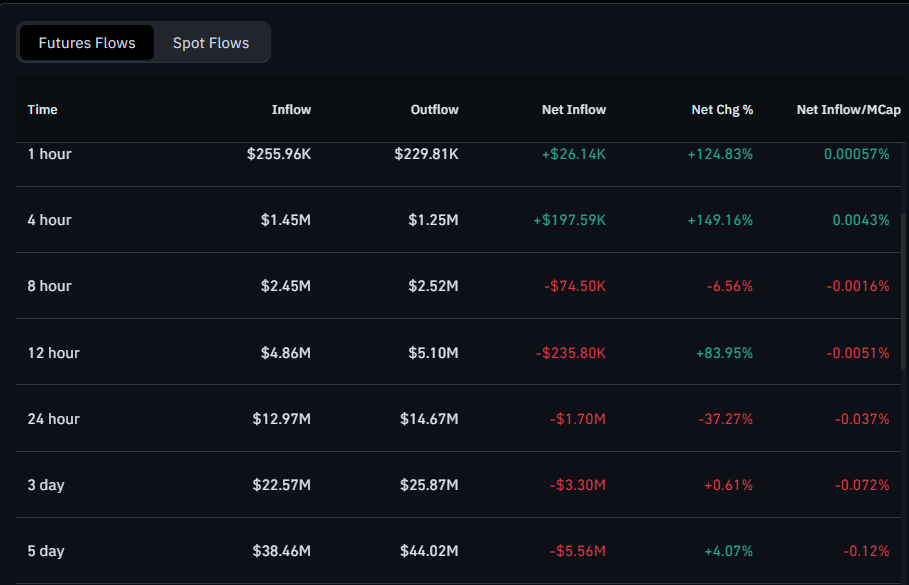 Shiba Inu futures trading volume
Although the net change indicator is positive (83.95%), the net value remains negative, indicating that the latest phase of bearish sentiment may have eased compared to before, but has not yet turned into net demand. Relative to market capitalization, net inflows are also slightly negative at 0.0051%.
Over 24 hours, the imbalance of capital outflows is even more pronounced: $12.97 million in inflows versus $14.67 million in outflows, resulting in a net outflow of about $1.7 million. The net change rate is -37.27%, and the net inflow/market cap ratio has dropped to 0.037%, indicating that compared to shorter time frames, net outflows are larger and open interest is weaker.
Expanding the time frame to three days, this pattern remains consistent. Total inflows amounted to $22.57 million, while total outflows reached $25.87 million, with a net outflow of about $3.3 million. Although the net change is only 0.61% (close to flat), cumulative net inflows over 12 hours, 24 hours, and three days are all negative, indicating that traders have generally been reducing rather than increasing their positions—unless these net inflows and outflows begin to decrease significantly or turn positive.
Disclaimer: The content of this article solely reflects the author's opinion and does not represent the platform in any capacity. This article is not intended to serve as a reference for making investment decisions.
You may also like
NVIDIA (NVDA.US) management changes may affect Anthropic's IPO plans; the market is watching whether the multi-billion-dollar investment will change
With the sudden departure of Nvidia CEO Jensen Huang, the record-breaking initial public offering plan of AI giant Anthropic is being reconsidered by the market.
Nebius Q3 results exceed expectations, capital expenditure rises to $27 billion, ARR target postponed, stock falls over 14% pre-market | Earnings Report Insights
Nebius reported Q3 revenue of $981 million (a year-on-year increase of 571%) and adjusted EBITDA of $466 million, both exceeding expectations. However, the company delayed and lowered its guidance for annual recurring revenue (ARR), stating that it is no longer applicable. Additionally, it significantly raised its 2026 capital expenditure target to $27 billion, with projections to further increase to $40 billion to $45 billion in 2027. The stock price plummeted more than 14% in pre-market trading.
AUD/USD Price Forecast: Breakdown of H&S pattern keeps the pair under pressure
U.S. Stock Market Preview | Major Index Futures Mixed; Nvidia Plunges Pre-market; Fed Officials' Speeches Incoming
Before the U.S. stock market opens on Thursday, November 12, the three major U.S. stock index futures showed mixed movements.
Crypto prices
More


