Bitget App
Trade smarter
Buy cryptoMarketsTradeFuturesStocksEarnInstitutionAI & More
Kaspa (KAS) To Rise Further? Key Emerging Patterns Suggests Potential Upside Move

Kaspa (KAS) To Rise Further? Key Emerging Patterns Suggests Potential Upside Move

CoinsProbeCoinsProbe2025/06/03 17:56
By:Nilesh Hembade

Date: Tue, June 03, 2025 | 09:58 AM GMT

The cryptocurrency market has staged a rebound from the mini pullback experienced last week, with Ethereum (ETH) leading the charge—climbing over 5% today and reclaiming the $2600 mark after dipping to a low of $2471 on Sunday.

Following ETH’s lead, altcoins are showing renewed strength. Kaspa (KAS) has jumped over 6%, trimming recent weekly losses 15%. But the charts suggest this could just be the beginning of another leg up.

Kaspa (KAS) To Rise Further? Key Emerging Patterns Suggests Potential Upside Move image 0 Source: Coinmarketcap

Multiple Patterns Hinting at Upside Move

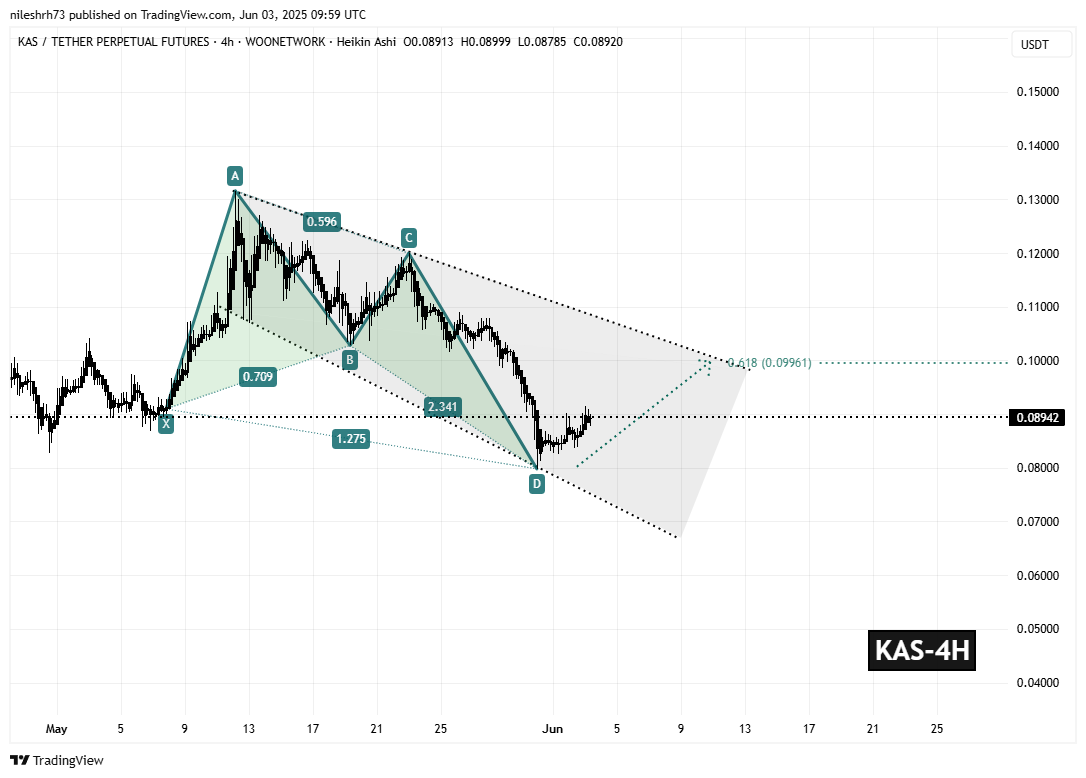
Zooming in on the 4-hour chart, KAS is showing signs of two powerful bullish formations: a broadening wedge and a bullish butterfly harmonic pattern.
Kaspa (KAS) To Rise Further? Key Emerging Patterns Suggests Potential Upside Move image 1 Kaspa (KAS) 4H Chart/Coinsprobe (Source: Tradingview)

The bullish butterfly pattern appears well-structured, with the recent bounce from point D at $0.07980 acting as a key reversal signal. This bounce has led to the formation of the final CD leg, which is now targeting the $0.09961 level. That’s still more than 11% upside from the current price of $0.08942.

Importantly, this $0.09961 level aligns closely with the 0.618 Fibonacci extension of the DA leg—commonly considered the ideal reversal zone in harmonic patterns. On top of that, this level is brushing up against the upper resistance line of the broadening wedge, adding confluence to the idea that a breakout might be on the horizon.

What’s Next for KAS?

If KAS can maintain momentum and push through the $0.0996 region, it could spark a breakout rally, potentially drawing in technical traders and fresh buyers. A clean breakout from the wedge pattern could set the stage for a larger trend continuation toward the $0.12–$0.13 zone.

Disclaimer: This article is for informational purposes only and not financial advice. Always conduct your own research before investing in cryptocurrencies.


0
0

Disclaimer: The content of this article solely reflects the author's opinion and does not represent the platform in any capacity. This article is not intended to serve as a reference for making investment decisions.

Understand the market, then trade.
Bitget offers one-stop trading for cryptocurrencies, stocks, and gold.
Trade now!

You may also like

US CPI Exceeds Expectations Again, Waller's Warning Comes True! Wall Street Focuses on Whether December Rate Hike Will Be 25 or 50 Basis Points; "New Fed News Agency": Stop-and-Go Strategy Faces Test

The "New Federal Reserve Newsletter" pointed out that before the release of the CPI, Waller suggested the possibility of a 50-basis-point rate hike in December, and so far, no other Fed officials have publicly responded. In addition to a single 50-basis-point hike, the Fed may also choose to signal consecutive rate hikes in December and January. Wall Street generally believes that inflationary pressures remain stubborn, further strengthening the case for a rate hike in December, though a 50-basis-point increase is not a consensus. The market is concerned about whether the Fed will extend the tightening cycle.

华尔街见闻•2026/11/10 18:25

CPI Deals a Blow to US Bonds! 2-Year Yield Surges Over 20 Basis Points Intraday, Gold and Silver Plunge

After the release of the CPI, traders began to expect a lower likelihood of a 50 basis point rate hike in December; this year’s Federal Reserve voting member Logan stated that a faster pace of rate hikes may be needed this winter, with at least two more 25 basis point hikes required before pausing. Subsequently, the rise in U.S. Treasury yields continued to widen, with the 10-year yield climbing back above 5.0% and rising more than 10 basis points intraday; spot gold once fell over 3%, while spot silver at one point dropped more than 4%.

华尔街见闻•2026/11/10 18:25