Date: Sun, June 01, 2025 | 09:40 AM GMT
he cryptocurrency market witnessed a sharp pullback over the week, dragging major tokens into the red. Bitcoin (BTC) briefly dropped to below $104K, while Ethereum (ETH) slipped below $2,500, down from recent highs of $111K and $2,700 respectively. This broad correction impacted major altcoins — including Jasmycoin (JASMY).
JASMY posted a weekly loss of over 12%, narrowing its 60-day gains to 43%. But while the short-term outlook may seem shaky, technical analysis suggests a potential bullish setup forming on the chart — one that could spark a fresh reversal in the coming days.
 Source: Coinmarketcap
Bullish Butterfly Harmonic Pattern
On the 4-hour chart, JASMY’s price movement is aligning closely with a textbook Bullish Butterfly Harmonic Pattern, a well-regarded structure known for predicting reversals following deep corrections.
The pattern begins with the XA leg, which stretched from $0.0144 to a peak of $0.0212, marking a strong bullish impulse. This was followed by the AB retracement, which pulled back close to 78.6% of the XA leg — consistent with the characteristics of this pattern. The BC leg then formed a lower high, respecting harmonic ratios and maintaining the structure’s validity.
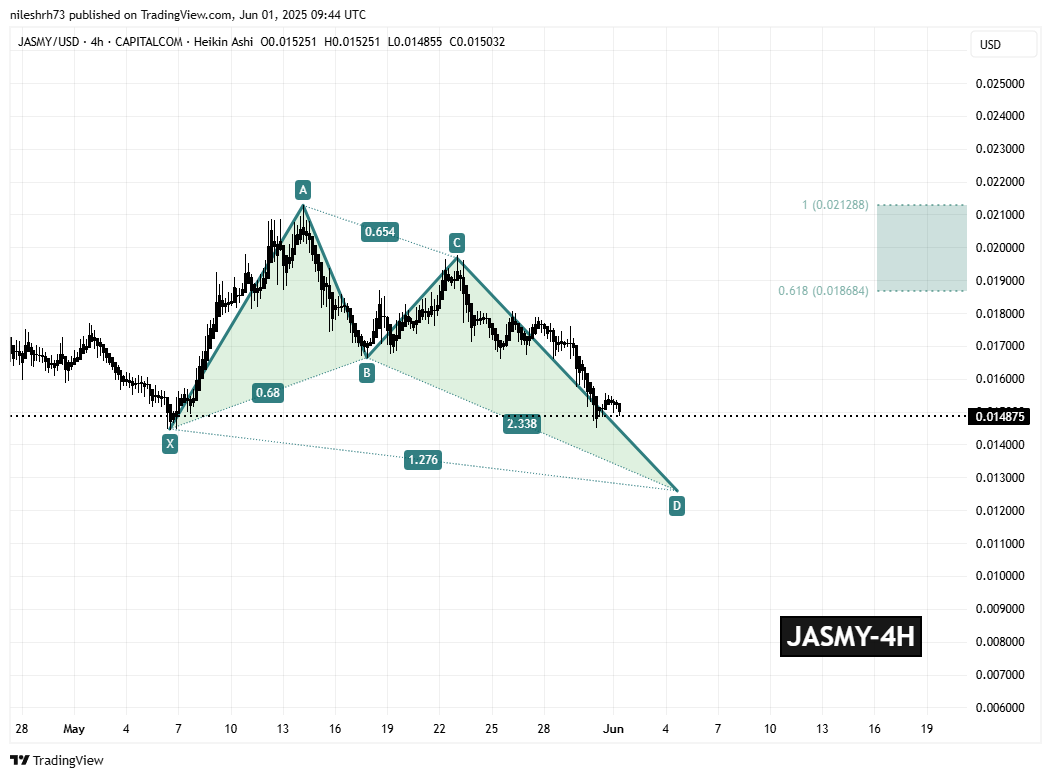 Jasmycoin (JASMY) 4H Chart/Coinsprobe (Source: Tradingview)
Currently, price action is shaping the final CD leg, which is projected to complete around the $0.01259 area. This price point aligns with the 1.27 Fibonacci extension of the XA leg, typically considered the potential reversal zone for bullish butterfly patterns. The completion of this leg would open up the possibility for a trend reversal, provided bullish confirmation appears at or near this zone.
At present, the market price is still about 15% above the projected D point, suggesting the pattern is not yet complete. However, if JASMY does move into this zone and shows signs of support, such as increased buying volume or bullish candlestick patterns, it could signal the beginning of a new upward move.
What To Expect Ahead?
If JASMY reaches the $0.01259 reversal zone and holds, it may begin a recovery rally. The first major resistance to watch would be the 0.618 Fibonacci retracement level around $0.01868. If momentum strengthens, the price could push further toward the $0.02128 level, which corresponds to the 1.0 Fibonacci retracement and aligns with previous local highs.
On the downside, a confirmed break and close below $0.0120 would invalidate the bullish harmonic setup. This would indicate that the expected reversal has failed and could open the door to deeper declines, potentially testing lower support levels established earlier in the year.
Disclaimer: This article is for informational purposes only and does not constitute financial advice. Always perform your own due diligence and consult with a professional financial advisor before making investment decisions in the cryptocurrency market.