Key Notes
- PEPE is trading around $0.00001288 after an 11% daily drop.
- Whale 0x3c9E deposited $6.47 million worth of PEPE to Binance.
- The whale still holds $6.41 million in meme coins and has profited $7.47 million in a month.
While the broader crypto market is facing a cooling period, frog-themed meme coin PEPE PEPE $0.000011 24h volatility: 13.0% Market cap: $4.80 B Vol. 24h: $1.92 B is taking a sharper hit than most. Over the past 24 hours, PEPE has dropped roughly 11%, trading around $0.00001288 at the time of writing.
The cryptocurrency’s market cap has shed more than $650 million in just one day, now standing at $5.42 billion. This drop coincides with a whale’s major exchange deposit.
On-chain data from Lookonchain shows that whale 0x3c9E deposited 502.5 billion PEPE tokens, valued at $6.47 million, onto Binance. Despite the transfer, the whale still holds 497.5 billion PEPE worth $6.41 million.
PEPE whale 0x3c9E deposited 502.5B $PEPE ($6.47M) to #Binance 20 minutes ago and still holds 497.5B $PEPE ($6.41M).
This whale has made a profit of $7.47M on $PEPE in just one month. https://t.co/VmJwGGQUWb pic.twitter.com/1w5EdOeksT
— Lookonchain (@lookonchain) May 30, 2025
The whale has already netted $7.47 million in profit over the past month, raising market concerns about a possible sell-off.
PEPE Price Outlook
On the daily PEPE price chart, the RSI currently indicates that the meme coin is nearing oversold territory but has not yet reached the extreme.
Traders can find immediate support in the $0.0000120–$0.0000124 demand zone. A break below this zone could lead to deeper correction to $0.0000100.
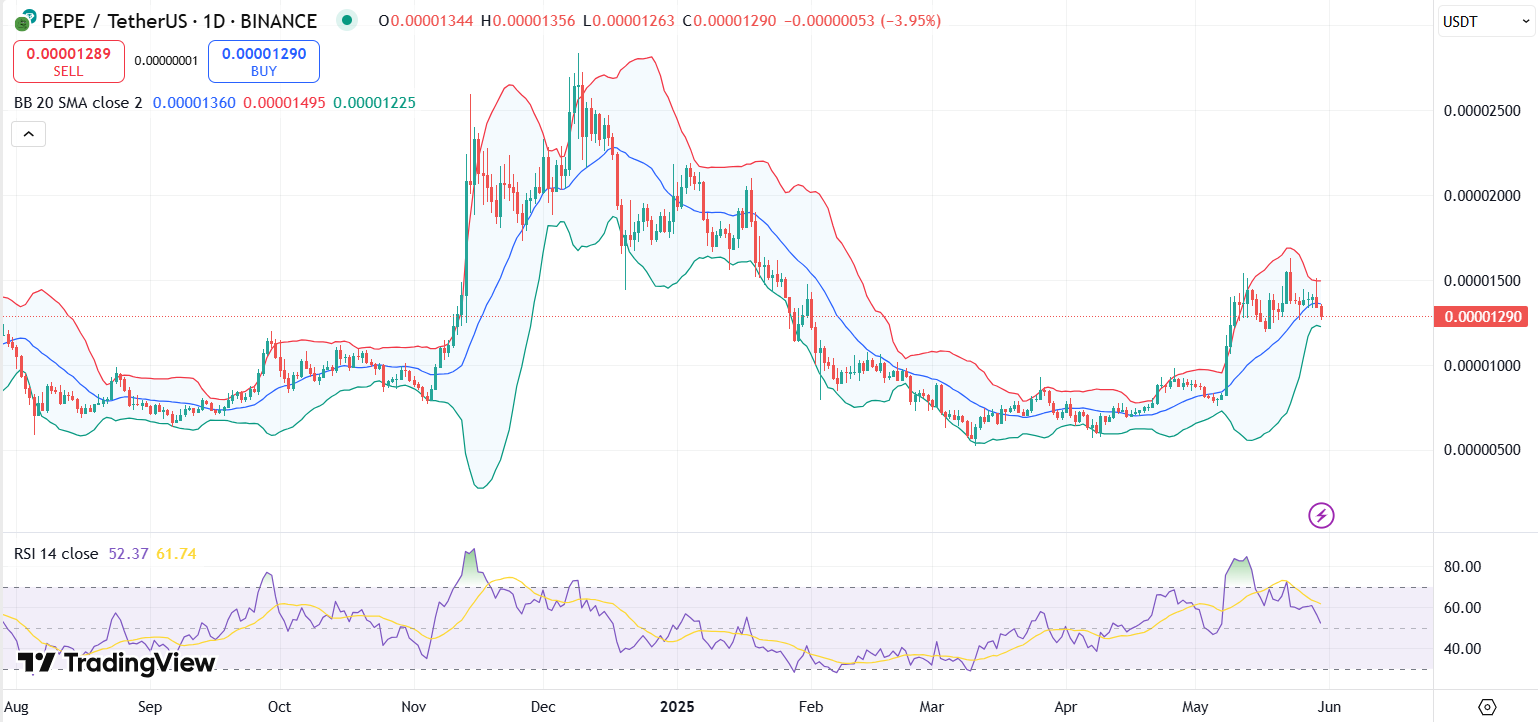
PEPE price chart with RSI and Bollinger Bands | Source: Trading View
Price candles have slipped below the mid-Bollinger Band (20-day SMA) and are brushing against the lower band, often a signal that the asset is oversold in the short term.
This suggests that a reversal could happen if buying pressure increases. Resistance lies around $0.0000135, followed by the critical $0.000015 psychological level. However, if prices continue to hug the lower band, it may indicate sustained bearish pressure.
Meanwhile, the MACD line has recently crossed below the signal line and the gap is widening. This bearish crossover typically results in downward movement.
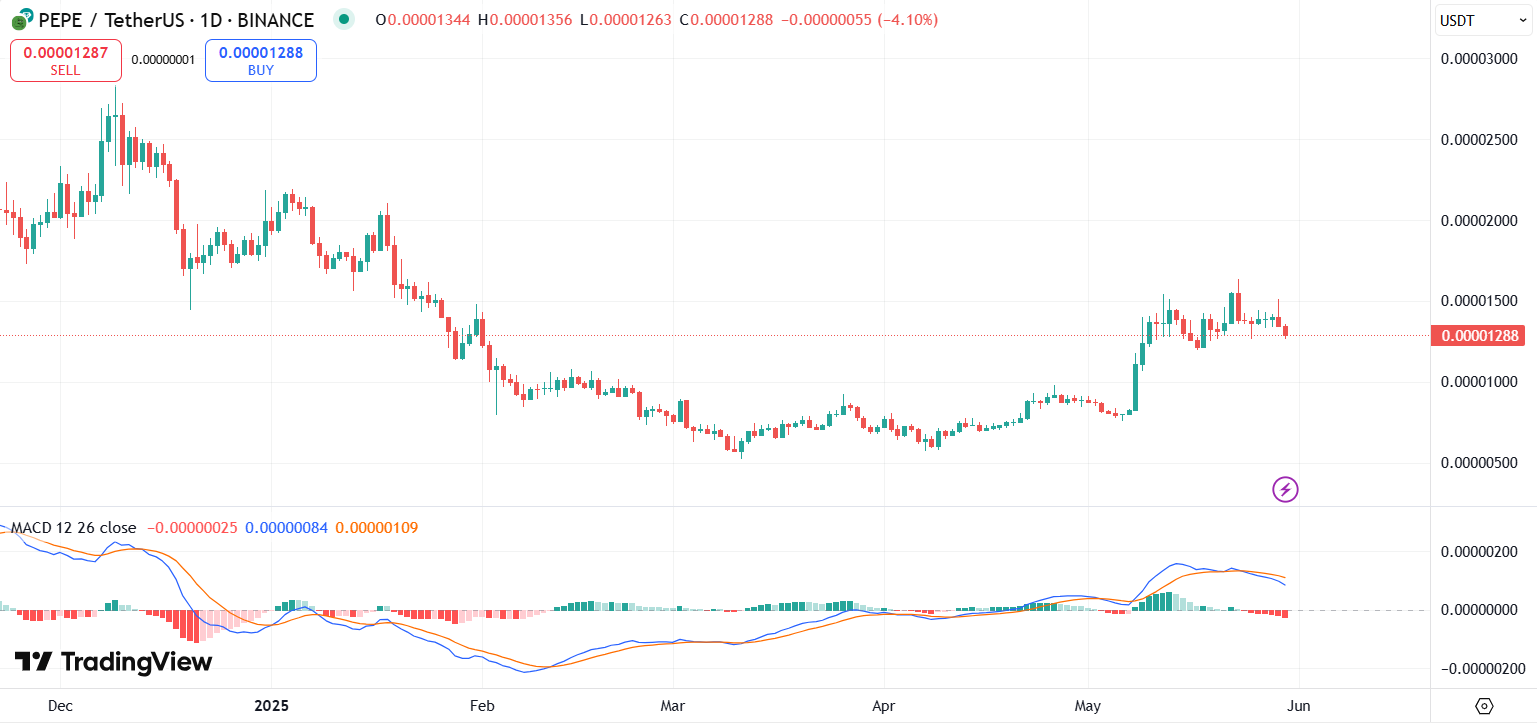
PEPE price chart with MACD | Source: Trading View
Earlier in May, PEPE recorded a sharp rebound from $0.000006, rallying 45% in the past month. However, current conditions suggest bulls are losing steam. Despite the recent dip, PEPE remains one of the best meme coins and among the largest by market cap, maintaining a multibillion-dollar valuation and strong market presence.
According to popular X crypto account PEPE ON FIRE, the token is clinging to a regression trend with support at $0.000013. They believe that a clean breakout above this level could lead the meme coin to the $0.000025 zone.
next$PEPE currently has a support level at $0.000013, and it's following a regression trend. A breakout above this level could indicate a bullish move, potentially targeting the $0.000025 range. #PEPE
Join here for more updates about $PEPE : https://t.co/d3vhB8muMp pic.twitter.com/UGMHHYJE68
— PEPE ON FIRE 🔥 (@PepeCZBinance) May 30, 2025
Disclaimer: Coinspeaker is committed to providing unbiased and transparent reporting. This article aims to deliver accurate and timely information but should not be taken as financial or investment advice. Since market conditions can change rapidly, we encourage you to verify information on your own and consult with a professional before making any decisions based on this content.