
Avalanche (AVAX): Balance Under Pressure, Upcoming Direction? Analysis Of May 29, 2025

After a marked correction, Avalanche stagnates below key levels: between selling pressure and a latent bullish bias. Find our complete technical analysis and AVAX outlook.
In brief
- Technical analysis: AVAX stabilizes around $23.50 in a neutral and unengaged market, with limited recovery and still weak momentum.
- Technical levels: AVAX trades between supports at $21 / $19 and resistances at $27 / $29; a breakout from the $22–35.3 range could trigger a strong directional move.
- Derivatives analysis: AVAX shows a consolidating market, dominated by moderate selling pressure despite a slight bullish bias on funding.
- Forecasts: Bullish bias above $21, with potential of +63%, but a break would expose AVAX to a drop of up to -37%; the macro and geopolitical context will remain key.
Technical Analysis of Avalanche (AVAX)
| Spot Price | ≈ $23.50 | The price rises slowly while remaining in a waiting zone with no real recovery signal. |
| Last Weekly Changes | ≈ +2% | Slight gain over the week, sign of a market trying to stabilize. |
| Last Weekly Spot Volumes | ≈ 756M (+0.33%) | Stable volumes, indicating moderate interest without strong momentum. |
| Long-term Trend (SMA 200) | Neutral | Trend in a stabilization phase after a long decline, awaiting a recovery signal. |
| Medium-term Trend (SMA 50) | Neutral | Structure with no clear direction, reflecting a period of waiting and consolidation. |
| Short-term Trend (SMA 20) | Bullish | Rebound showing active short-term buyer flow, however progression remains limited. |
| Momentum | Neutral | Weak and stable momentum, with slight buying pressure without clear acceleration. |
The spot price of AVAX stabilizes around $23.50, showing a slight weekly increase of about 2%, in a context of nearly unchanged volumes around 756 million dollars. The long-term trend remains neutral, marking a transition phase after a prolonged bearish period. In the medium term, the market moves without a clear direction, reflecting a lack of conviction. In the short term, a buying dynamic is visible, although progress remains contained. Momentum remains weak but balanced, without notable acceleration, indicating a watchful market where flows are present but lightly engaged.
Avalanche (AVAX) Technical Levels
| Resistances | $27 / $29 / $38 / $45 | Potential distribution zones; surpassing them would open the way for bullish extension. |
| Supports | $21 / $19 / $17 / $14.5 | Historic demand zones; breaking them would expose to a risk of continued decline. |
| Monthly Pivot Point | $19.5 | Reference level for the monthly trend. |
| High Value Area | $35.3 | High volume zone; upper boundary of a market balance, beyond which an imbalance may emerge. |
| Low Value Area | $22 | High volume zone; lower limit of a market balance, beyond which an imbalance may emerge. |
AVAX faces several major technical levels. Resistances at $27, $29, $38, and $45 correspond to potential distribution zones, whose crossing could favor a bullish recovery. Supports at $21, $19, $17, and $14.5 represent historic demand zones, and their break would increase the risk of a continued decline. The monthly pivot point at $19.5 serves as a benchmark for the underlying trend. The low value area at $22 marks the lower boundary of a market equilibrium, while the high value area at $35.3 forms the upper boundary. Breaking either boundary could cause an imbalance likely to trigger a significant directional move.
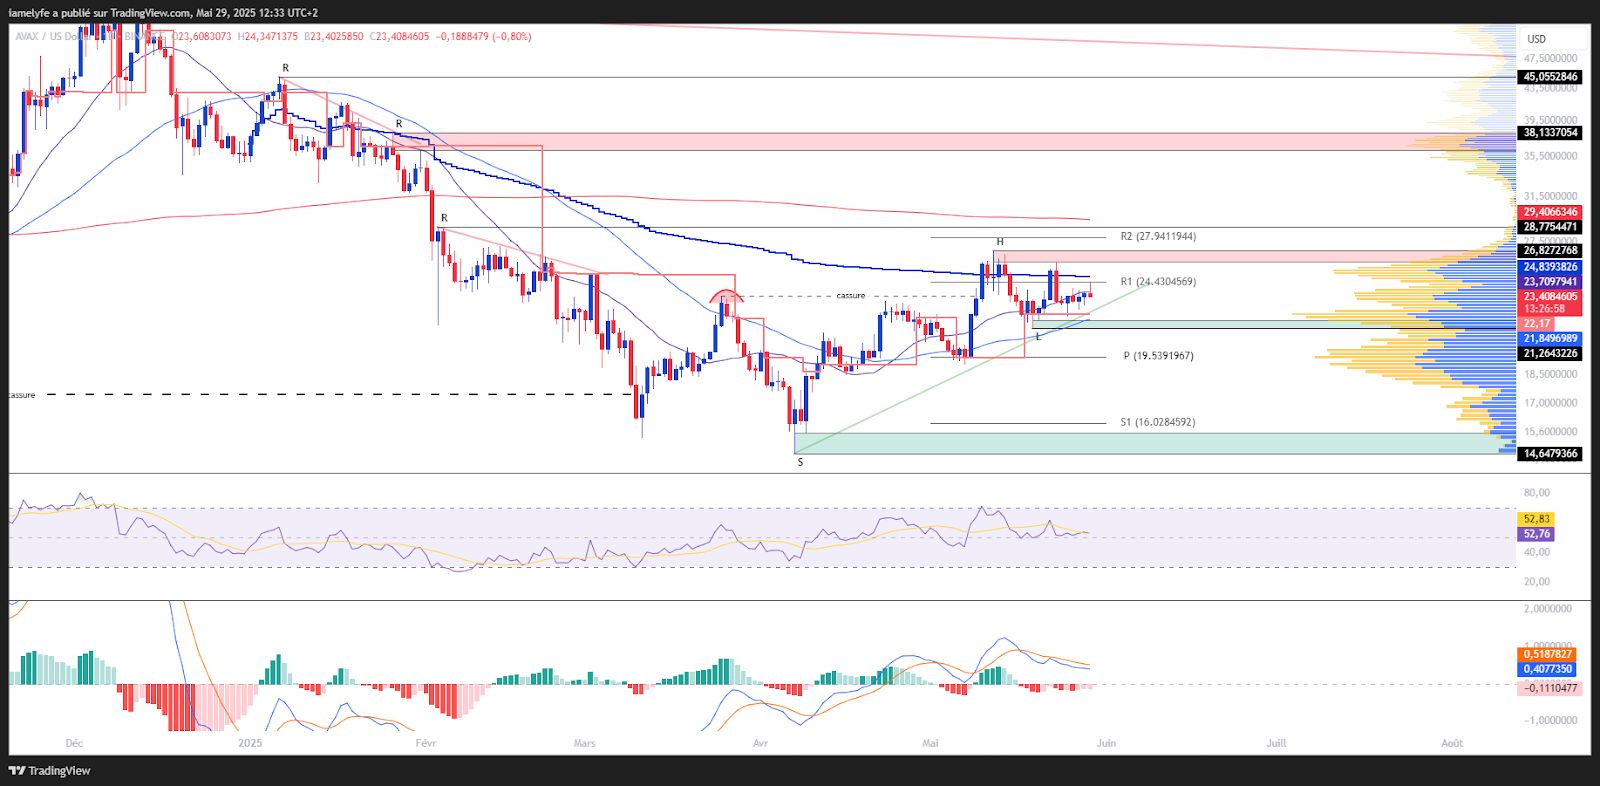 AVAX/USD Daily Chart
The current technical analysis was carried out in collaboration with Elyfe , and 0xhugzer , investors and educators on the cryptocurrency market.
Derivatives Analysis (AVAX/USDT)
| Open Interest | Stable | Position stability, reflecting a consolidating or waiting market. |
| CVD | Sell-side dominance | Sell dominance: aggressive sell orders dominate trading. |
| Liquidation | Low, long side | Low liquidations, but oriented longs, consistent with dominant selling pressure. |
| Funding Rate | Slightly positive | Slight bullish bias, moderate premium for long positions. |
Open positions on AVAX/USDT contracts remain stable, a sign of a waiting or consolidating market. Flows reveal sell-side dominance with aggressive sell orders. Liquidations remain low but mainly affect longs, consistent with this bearish pressure. Despite this, the slightly positive funding rate reflects a persistent slight bullish bias among traders.
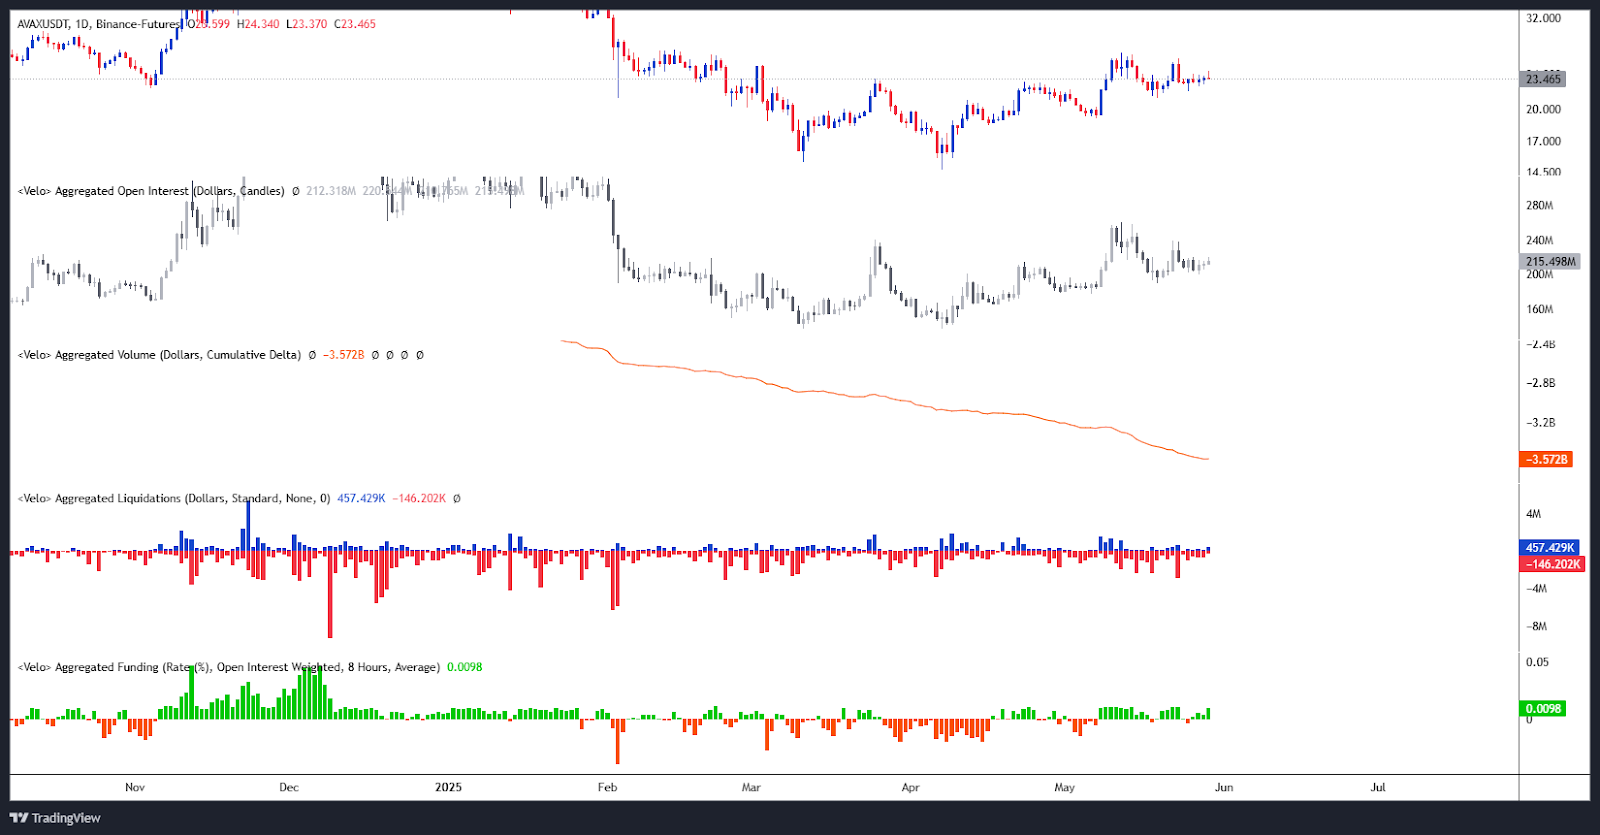 Open Interest / Liquidations / CVD & Funding rate
| Indicator | Status | Comment |
| Sell-side liquidation zone | ≈ $24.90 / $25.20 – $25.50 / $26 – $26.30 / $26.80 – $27.20 | Order concentration zone; reaching these levels could cause increased volatility. |
| Buy-side liquidation zone | ≈ $22 – $21 / $20.70 – $20.50 / $20.30 – $20 / $19.10 – $18 | Order concentration zone; reaching these levels could cause increased volatility. |
Several liquidation zones are identified on the market that could amplify volatility if approached. On the sell side, order concentration levels are at $24.90, then between $25.20 and $25.50, $26 and $26.30, as well as between $26.80 and $27.20. On the downside, buy-side liquidation zones are at $22 – $21, $20.70 – $20.50, $20.30 – $20, and finally between $19.10 and $18. Reaching these key levels could trigger rapid market reactions.
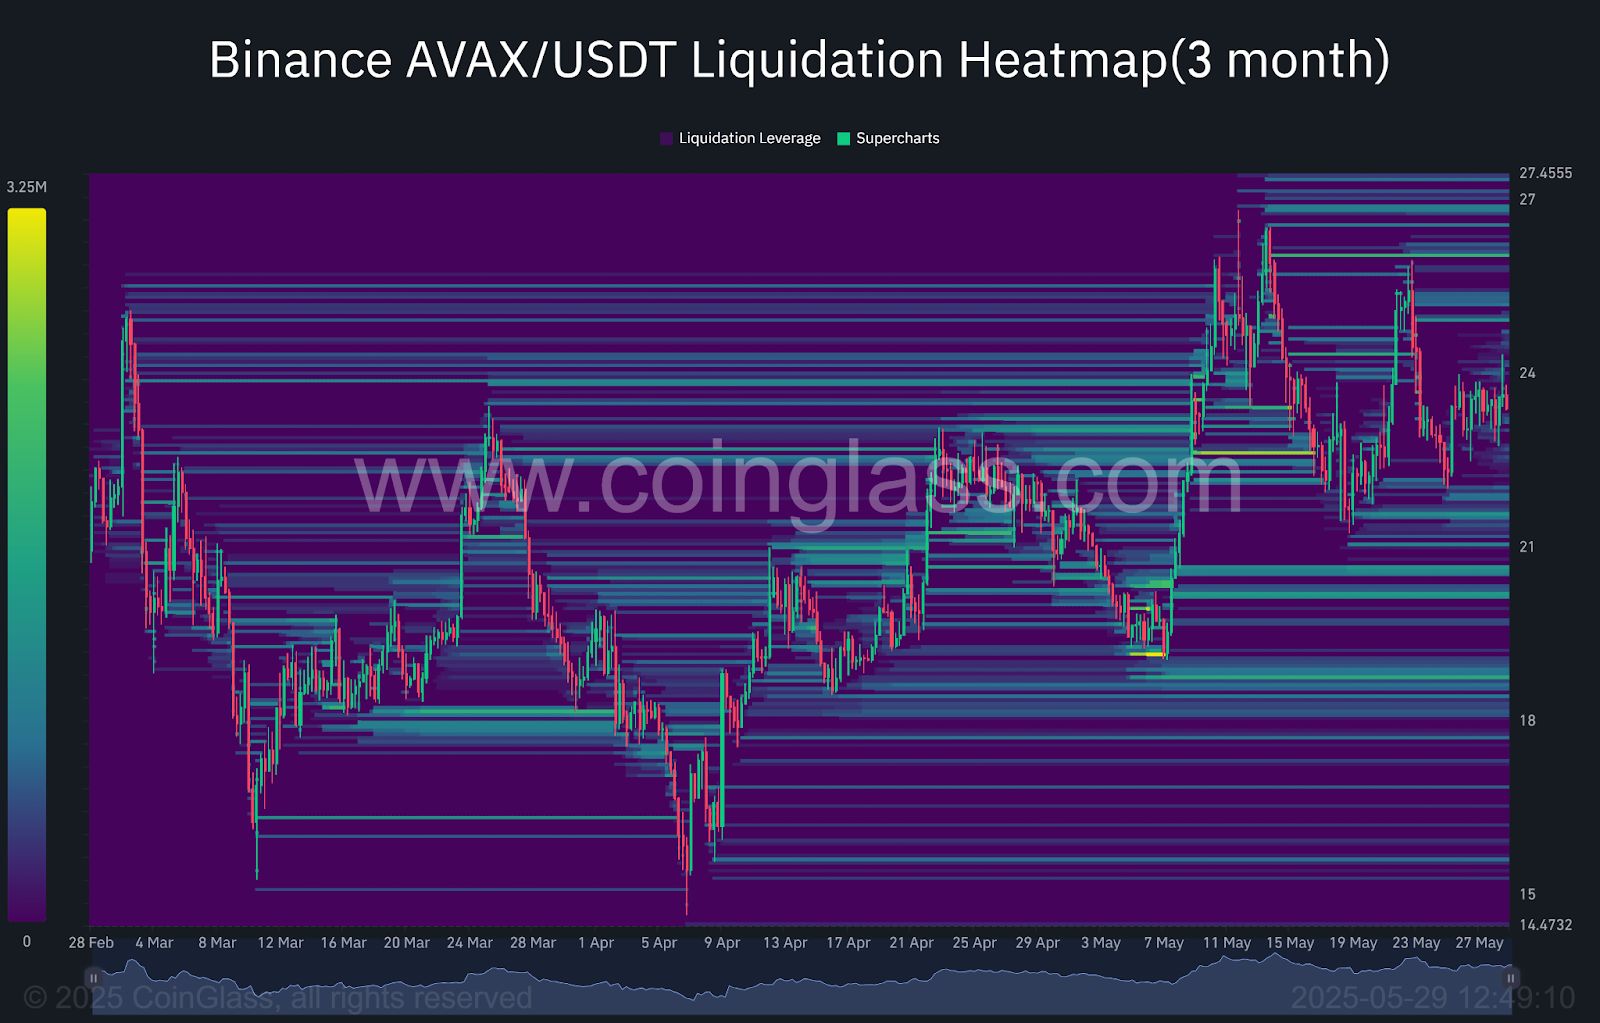 Liquidation Heatmap
Forecasts for Avalanche (AVAX) Price
Bullish scenario:
- Conditions: Maintaining above $21.
- Targets: $27 / $29 / $36 – $38.
- Potential: Approximately +63% from current level.
Bearish scenario:
- Conditions: Break of the $21 support.
- Targets: $18 / $15.5 – $14.6.
- Potential: Drop up to -37% from current level.
Comment:
The bias remains bullish, but US macroeconomic indicators as well as news related to the global geopolitical context will be decisive to confirm this scenario.
Conclusion
AVAX moves in a fragile balance, with dominant selling pressure despite a persistent bullish bias. Interest remains moderate and without clear momentum, while several sensitive zones could amplify volatility if triggered. The macroeconomic and geopolitical context will play a key role in the future market direction. In this context, it will be essential to closely monitor price reactions at strategic levels to confirm or adjust current forecasts.
Finally, remember that these analyses are based solely on technical criteria, and cryptocurrency prices can change rapidly according to other more fundamental factors.
Disclaimer: The content of this article solely reflects the author's opinion and does not represent the platform in any capacity. This article is not intended to serve as a reference for making investment decisions.
You may also like
Avalanche Price Prediction November 2026: Can AVAX Break $9.03?

US CPI Exceeds Expectations Again, Waller's Warning Comes True! Wall Street Focuses on Whether December Rate Hike Will Be 25 or 50 Basis Points; "New Fed News Agency": Stop-and-Go Strategy Faces Test
The "New Federal Reserve Newsletter" pointed out that before the release of the CPI, Waller suggested the possibility of a 50-basis-point rate hike in December, and so far, no other Fed officials have publicly responded. In addition to a single 50-basis-point hike, the Fed may also choose to signal consecutive rate hikes in December and January. Wall Street generally believes that inflationary pressures remain stubborn, further strengthening the case for a rate hike in December, though a 50-basis-point increase is not a consensus. The market is concerned about whether the Fed will extend the tightening cycle.
CPI Deals a Blow to US Bonds! 2-Year Yield Surges Over 20 Basis Points Intraday, Gold and Silver Plunge
After the release of the CPI, traders began to expect a lower likelihood of a 50 basis point rate hike in December; this year’s Federal Reserve voting member Logan stated that a faster pace of rate hikes may be needed this winter, with at least two more 25 basis point hikes required before pausing. Subsequently, the rise in U.S. Treasury yields continued to widen, with the 10-year yield climbing back above 5.0% and rising more than 10 basis points intraday; spot gold once fell over 3%, while spot silver at one point dropped more than 4%.
Historical Data Reveals When XRP Could Peak This Cycle
Crypto prices
More


