$XRP Reaches the Fib Confluence Around $1.10
The decline began after $XRP failed to hold its September recovery near the $1.50-$1.60 region.
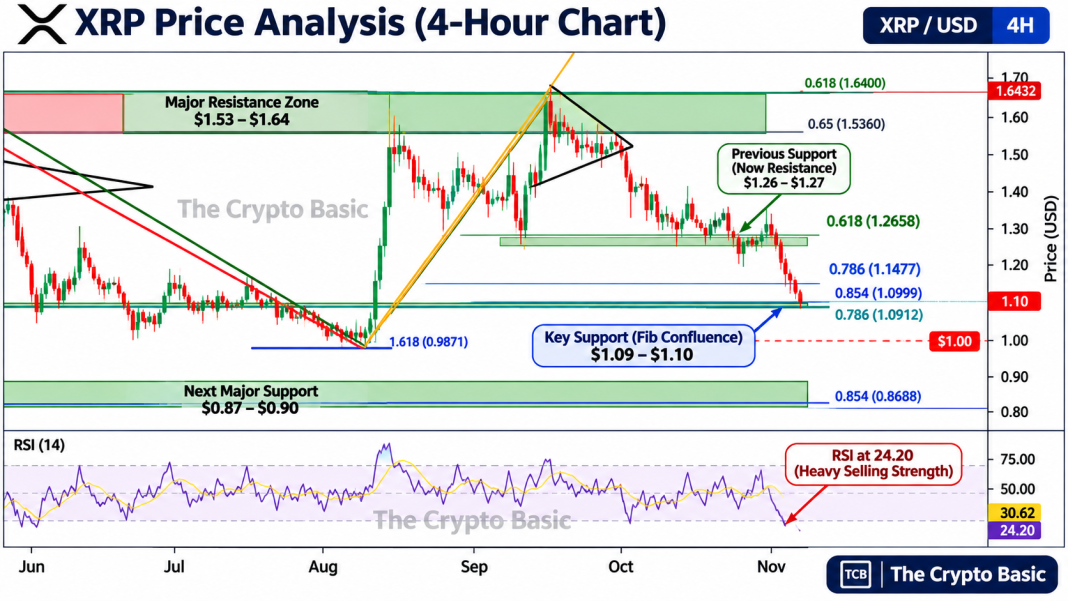
Price subsequently formed a series of lower highs before losing the $1.2658 Fibonacci support. Selling then accelerated toward the next retracement at $1.1477, but that level also failed to produce a sustained recovery.
 $XRP
reached the $1.10 Fibonacci convergence zone on Coinbase’s four-hour chart, while RSI near 24 shows selling momentum remains elevated.
The latest leg brought $XRP into the $1.09-$1.10 area.
This outcome follows earlier The Crypto Basic coverage that identified $1.10 as the next major level after $XRP lost $1.26. Another structure similarly placed the broader $XRP support zone between $1.10 and $1.29.
The current test is therefore not simply psychological support at a round number. Two Fibonacci structures are converging in roughly the same price region.
RSI Remains Deeply Oversold
Momentum has not yet provided clear evidence that sellers are finished.
The four-hour RSI reading sits near 24.20, well below the conventional oversold threshold of 30. A second plotted momentum line stands around 30.62.
An RSI below 30 can precede relief rebounds, but it also confirms that downside momentum has been unusually strong. Oversold conditions therefore do not establish a bottom by themselves.
This is particularly important because $XRP has already reached $1.10 without producing a decisive reversal.
The next meaningful bullish signal would require price to stabilize above the Fibonacci support and begin recovering lost levels. The first major retracement overhead sits around $1.1477, followed by the more important $1.2658 area.
Until $XRP starts reclaiming those levels, any rebound remains vulnerable to another test of $1.10.
A Break Below $1.09 Puts $1 Back in Focus
The downside structure becomes increasingly important if buyers cannot defend the current zone.
A move beneath the macro 0.786 retracement at $1.0912 would leave the psychological $1 level as the next major area.
The chart contains another technical reference near $0.9871, closely aligning with that $1 region.
From $1.10, a decline to $1 would represent another 9.1% loss.
That area also carries historical significance. $XRP traded near $1 during its August bottom before producing the recovery toward $1.70. Recent The Crypto Basic analysis has likewise kept the $1 region in focus as lower fair-value-gap support.
If $1 also fails, the deeper Fibonacci structure identifies approximately $0.8688, putting the broader $0.87-$0.90 region into play. A separate technical setup recently highlighted roughly $0.90 as the next major downside zone beneath the $1 area.
Buyers Now Need to Prove $1.10 Is the Bottom
The $1.10 target has been reached, but reaching support is different from confirming that support will hold.
For the immediate structure to improve, $XRP first needs to prevent sustained trading below $1.09-$1.10 and recover $1.1477. A stronger reversal would require reclaiming $1.2658, which previously acted as an important support floor before the latest breakdown.
Until those recoveries occur, another $1.10 test remains possible, while a clean break beneath the Fibonacci convergence would shift attention toward $1.00 and potentially the $0.87-$0.90 region.