
On November 5th, the US stock market plunged—this is a typical case of "active selling triggering passive selling", causing a liquidity shock in the market.

Today, I read an analysis by Bloomberg on the previous day's sharp decline in the US stock market, "Anatomy of a Selloff: Sudden Chain Reaction Rattles Wall Street." This piece is very much worth studying.
Core conclusion: The US stock market crash on November 5th was not just about investors turning bearish on AI, but was a typical case of "active selling triggering passive selling," resulting in a liquidity shock in the market.
Ordinary investors were the first to sell, followed by hedge funds, traditional institutions, and quantitative trading systems. The negative Gamma hedging by options market makers further amplified the decline.
About $3.7 trillion in market capitalization evaporated from the US stock market that day, but this does not equal $3.7 trillion in cash exiting the market.
This was an extremely rare market trading day—the US stock market lost about $3.7 trillion in market cap within a single day!
Ironically, the initial drop was not triggered by any company suddenly releasing major negative news, but rather by retail investors beginning to take profits.
However, what really turned this ordinary selling into a snowballing market crash was the automated trading systems in the market.
US Stock Investment Network outlines the whole process as follows:
Phase one: Retail investors sell first
Retail investors were the initial driving force of this sell-off.
According to Vanda Research, US retail investors' net sales of individual stocks on November 5th hit the third highest on record.
Only two trading days during the March 2020 global financial panic caused by the pandemic saw higher net sales by retail investors.
Phase two: Hedge funds and traditional institutions follow suit
After retail selling, hedge funds began to reduce their positions, followed by traditional long-only funds joining the sell-off.
One of the main motivations for these funds was to protect the investment returns accumulated since 2026, avoiding further market declines eroding annual profits.
More seriously, the market lacked large buyers willing to absorb these sales.
In other words, there were more and more sellers, but insufficient buying-side liquidity.
Phase three: Three types of quantitative trading systems simultaneously trigger selling
This is the true key phase that amplified the market decline.
These strategies do not require fund managers to make ad hoc judgments on company value; instead, they automatically adjust positions based on price, volatility, or preset risk rules.
1. CTA: Trend following funds, $1.3 billion
CTA (Commodity Trading Advisors) originally focused on commodity futures trading, but many CTA strategies now also trade equity index futures extensively.
When the S&P 500 and Nasdaq indices broke key technical levels, trend-following models triggered sell signals.
Vanda estimates that this type of strategy sold about $1.3 billion worth of S&P 500 and Nasdaq index futures.
2. Volatility-Control Funds, $6.1 billion
These funds dynamically adjust their equity risk exposure to keep the portfolio's risk at a target level.
When market volatility suddenly rises, they are forced to reduce risk exposure.
On November 5th, the VIX spiked. Nomura estimated that, given market changes at the time, such funds would need to cut about $6.1 billion in stocks.
3. Leveraged ETFs, $4.7 billion
Leveraged ETFs need to maintain the daily leverage ratio at the target, such as 2x or 3x.
When the stock market plummets, long leveraged ETFs typically need to sell stocks or reduce derivative exposure to rebalance leverage ratios.
Nomura estimated this mechanism could lead to an additional selling demand of about $4.7 billion before the market close.
Phase four: Options market makers' negative Gamma hedging further amplified the decline
There is another force in the market that ordinary investors often overlook: the dynamic hedging of options market makers.
When market makers are overall in a negative Gamma (Short Gamma) position:
- The stock market declines, requiring them to sell more stocks or stock index futures for hedging.
- Selling further pushes stock prices down.
- As prices fall further, more hedging sales are triggered.
Nomura estimated that each 1% market drop could trigger about $700 million in additional hedging-related selling pressure at that time.
As a result, the market entered a vicious cycle:
Active selling by retail and institutions
Stock prices break technical levels, VIX surges
CTA sells futures
Volatility-control funds reduce positions
Leveraged ETF rebalancing
Negative Gamma hedging adds on selling pressure
Stock prices drop further, triggering another round of selling
It is worth noting: the $1.3 billion in CTA selling is Vanda's estimate; the $6.1 billion and $4.7 billion are mainly Nomura's model calculations for the size of position reductions or expected rebalancing; and the $700 million is an estimated sensitivity per 1% drop. These figures cannot be directly added together, nor should they all be interpreted as already completed actual selling.
Original Title: Only Two VIX Spikes Have Started Calmer and Gone Further
Translation: Since 1990, only a handful of times has the VIX risen this sharply from such a low starting point in a single day.
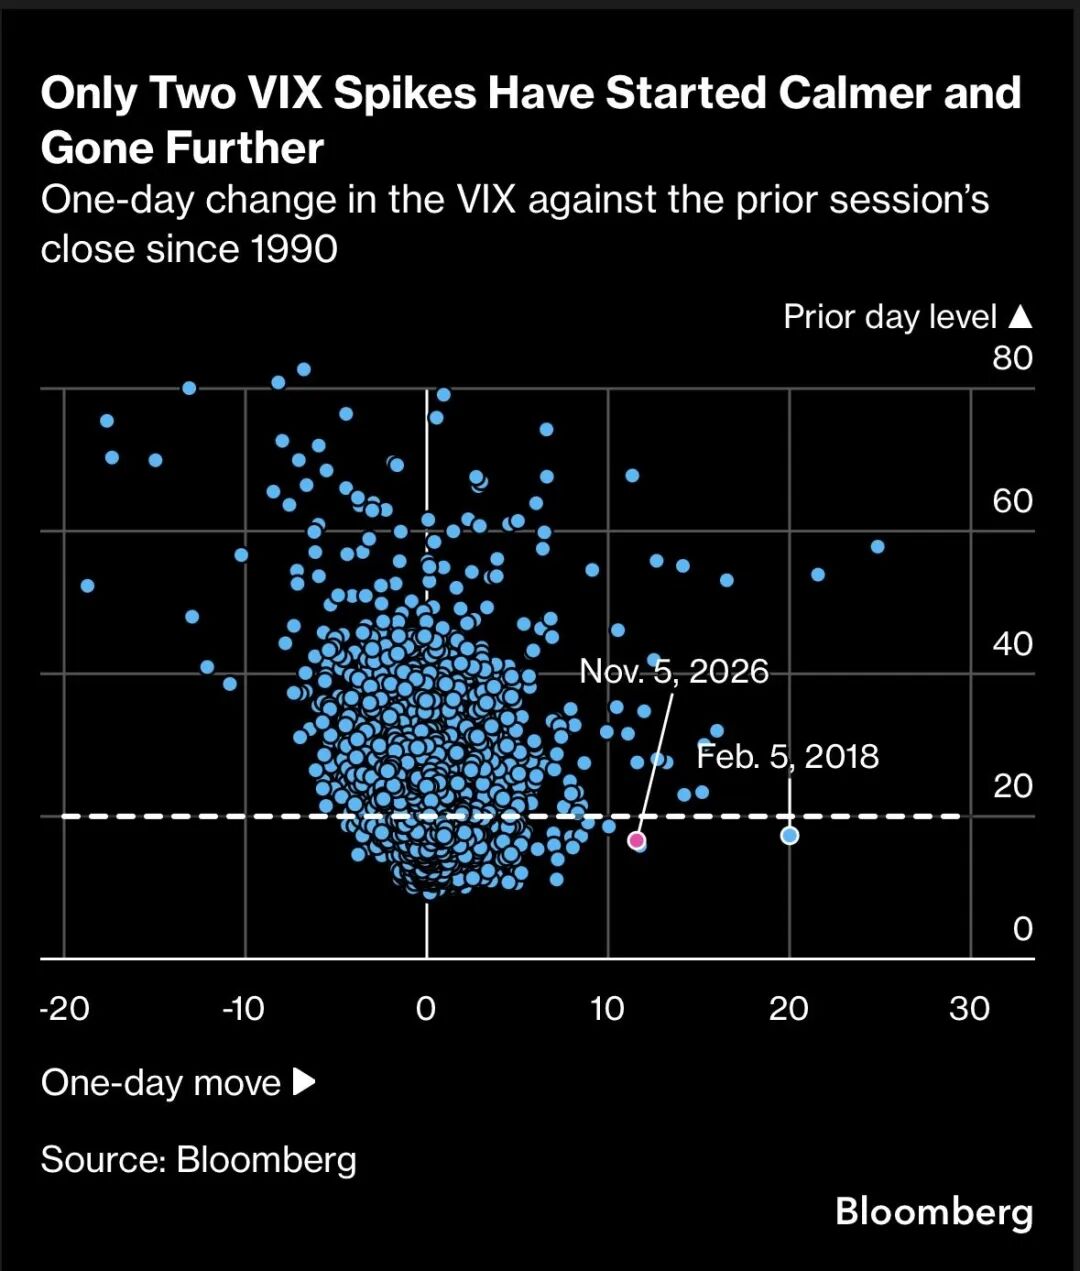
The horizontal axis of the chart is the single-day change in VIX, while the vertical axis is the VIX closing level from the previous trading day.
VIX on November 4th: 16.61
VIX on November 5th: 28.18
Single-day increase: +69.7%
This is the third largest single-day percentage increase in VIX since 1990, after February 5th, 2018, and December 18th, 2024.
Key interpretation:
Normally, market risk accumulates gradually, and VIX rises steadily.
But this time, the VIX jumped from 16.61 to 28.18, meaning the market repriced risk drastically in a very short time.
Why is this so dangerous for the market?
Because many quant strategies had allocated larger stock exposures based on previously low volatility levels.
The sudden spike in volatility forced them to reduce risk. This may form a second wave of selling, compounding the first round driven by fundamentals or sentiment.
However, a large one-day VIX jump does not mean market panic is at an extreme. An absolute level around 28 is still significantly lower than the extremes reached during the 2020 pandemic collapse.
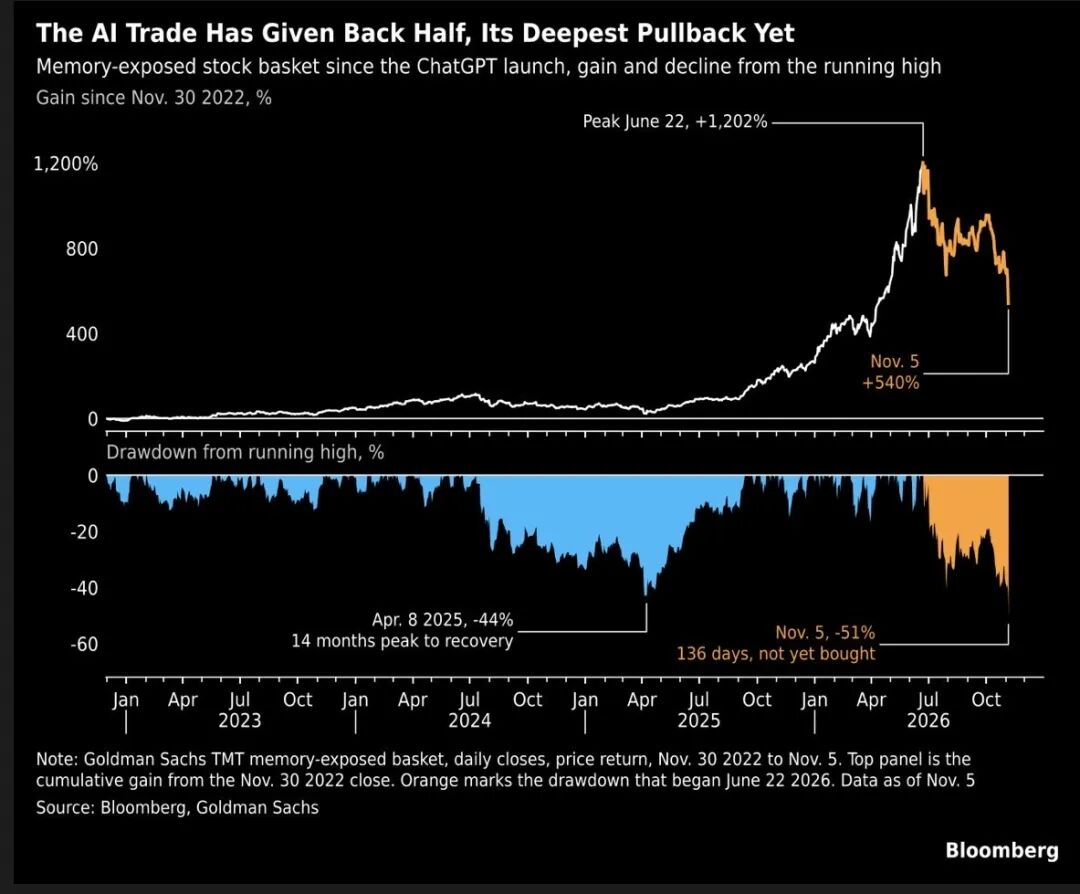
Original Title: The AI Trade Has Given Back Half, Its Deepest Pullback Yet
Translation: AI investment trades have retraced over 50% from their peak, the deepest correction in this cycle.
This chart tracks a Goldman Sachs-constructed basket of stocks highly sensitive to AI memory demand—not the entire AI sector, nor the Nasdaq Index.
Goldman Sachs AI memory-related stock basket: Cumulative return
Using November 30, 2022 as a starting point, it compares the 2026 peak with November 5th.
It's important to avoid a common misreading:
A drop from a cumulative +1,202% to +540% does not mean a total loss of 662% gains, but a drawdown of about 51% from the peak portfolio value.
Compared with a 44% drawdown on April 8, 2025, this decline is more severe and its duration is worth noting.
The original Bloomberg report also provided key data:
- On November 5th, baskets of stocks related to AI memory, optical communication, data centers, and AI semiconductors all fell about 12%–15% in a single day.
- Excluding AI-related stocks, the S&P 500 dropped only about 2.3% that day.
- Several AI-themed stock baskets experienced their worst single-day declines since the launch of ChatGPT.
This indicates that the November 5th decline was not just a broad market sell-off, but was highly concentrated in the previously high-flying, crowded AI industry chain.
The original article explains the plunge as retail profit-taking triggering a chain reaction. This is valuable, but incomplete.
It explains why the market fell so quickly, but not why investors suddenly decided to sell.
Both the original Bloomberg report and Reuters noted that after the US midterm election on November 3, 2026, with Democrats taking control of both houses of Congress, the market began to reassess the political and regulatory risks facing AI data center expansion.
The market initially rose on November 4th, but began to reprice those risks on November 5th. At the same time, the AI trade itself was already extremely crowded.
Therefore, I would break down this crash into three layers:
| Layer | Main Driving Factor | Market Impact |
| First layer: Catalyst | Policy changes, re-pricing of AI infrastructure risks | Triggers active selling |
| Second layer: Positioning | Crowded AI holdings, funds locking in profits | Amplifies active sell-off |
| Third layer: Market structure | CTA, volatility-control funds, leveraged ETFs, negative Gamma | Amplifies the decline and volatility |
The real concern should be whether the first-layer risk continues to worsen.
If it is only de-leveraging driven by the second and third layers, the market may rebound quickly after selling pressure subsides.
But if the first layer drives continued markdowns in AI capital expenditure forecasts and corporate earnings expectations, then even when mechanical selling ends, it may not mean stock prices have bottomed.
On Friday, November 6, the Nasdaq 100 rebounded by nearly 2%, but the VIX remained near 28, indicating that although there has been some recovery, investor risk concerns have not fully subsided.
My suggestions are to watch four key signals:
- VIX and term structure. If VIX falls and the curve between near-term and long-term volatility normalizes, it suggests market de-risking pressure may be easing.
- Whether quant fund deleveraging has ended. Track CTA positions, volatility strategy target exposures, and ETF rebalancing needs before close.
- The relative strength of AI core sectors. Observe whether stocks such as MU, MRVL, NVDA, as well as memory, semiconductor, and optical communications equities like LITE and COHR can find support before merely following the index rebound.
- AI companies' credit risk. Reuters reported on November 6 that CoreWeave's 5-year CDS spreads exceeded 1,000 basis points, signaling rising concern over AI infrastructure financing risk. However, at that time, US Treasuries and the broader financing market had yet to show systemic crisis pressure.
According to US Stock Investment Network, this plunge was driven by two distinct forces: repricing of the AI industry chain's valuation and policy expectations, and forced de-risking due to market structure.
The investment implications are different for each force.
- If forced deleveraging is the main reason, quality AI stocks might experience strong rebounds after the selling subsides.
- If AI capital spending, project financing, and profit forecasts continue to deteriorate, then a rebound may simply be a short-term correction within a longer-term adjustment process.
Especially noteworthy: the 51% drawdown in the Goldman Sachs memory stock basket from its peak is neither proof that the AI bubble has burst, nor evidence that now is definitely the time to bottom fish.
What I am most focused on now is not how much the VIX has risen, but whether, after mechanical selling ends, there will be genuine active buying willing to re-enter AI stocks.
This is the key dividing line to determine whether we are witnessing a "post-liquidity shock rebound" or an "AI sector repricing."
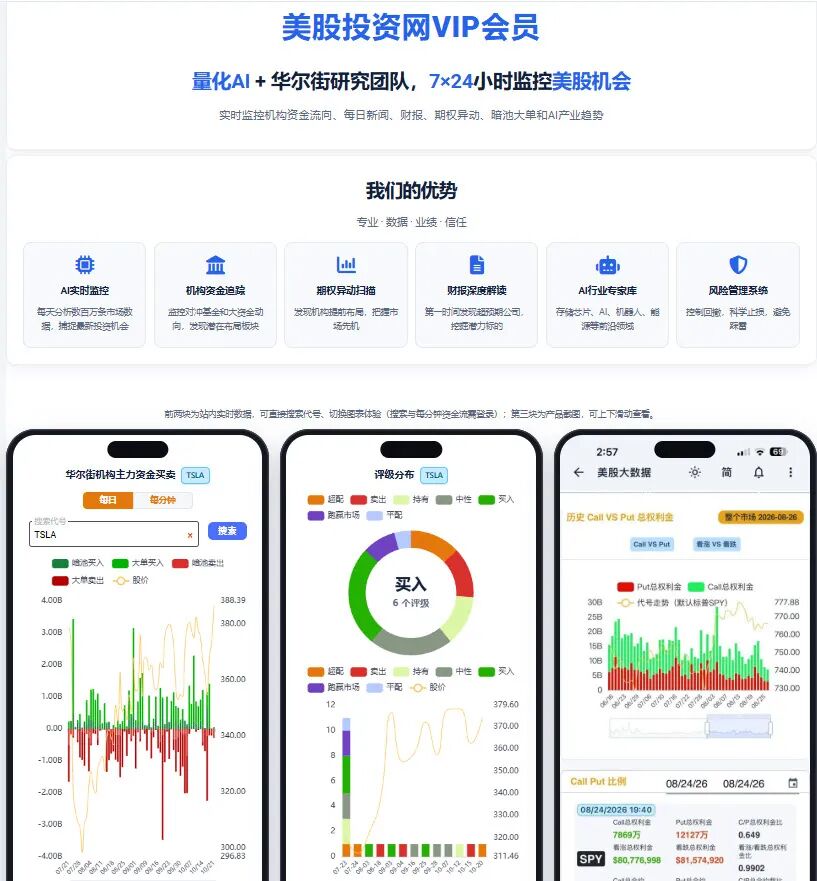
Join US Stock Investment Network VIP
Get first-hand Wall Street news and exclusive quantitative research tools


Disclaimer: The content of this article solely reflects the author's opinion and does not represent the platform in any capacity. This article is not intended to serve as a reference for making investment decisions.
You may also like
What Would Bitcoin Look Like Without the Trump Effect?

SUI Channel Recovery Faces Key Resistance Levels
Hyperliquid Strategies reveals $620 million Q3 profit, files for US futures license
TeraWulf Says AI Leasing Now Generates 83% of Revenue as Bitcoin Mining Recedes
Crypto prices
More


