
A chart on commodity support and resistance: Gold, Silver, Oil, Gas + Platinum, Palladium, Copper, Agricultural Futures (October 19, 2026)

Huitong Net, October 19 — An infographic of commodity support and resistance: gold, silver, oil, gas + platinum, palladium, copper + agricultural futures, updated Monday, October 19, 2026, 07:00 (UTC+8). It specifically covers 14 types including gold, silver, platinum, palladium, copper + crude oil, natural gas, fuel oil + wheat, corn, cotton. For more details, see the dedicated chart by Huitong Finance Xiruo.
An infographic of commodity support and resistance: gold, silver, oil, gas + platinum, palladium, copper + agricultural futures, updated Monday, October 19, 2026, 07:00 (UTC+8). It specifically covers 14 types including gold, silver, platinum, palladium, copper + crude oil, natural gas, fuel oil + wheat, corn, cotton. For more details, see the dedicated chart by Huitong Finance Xiruo.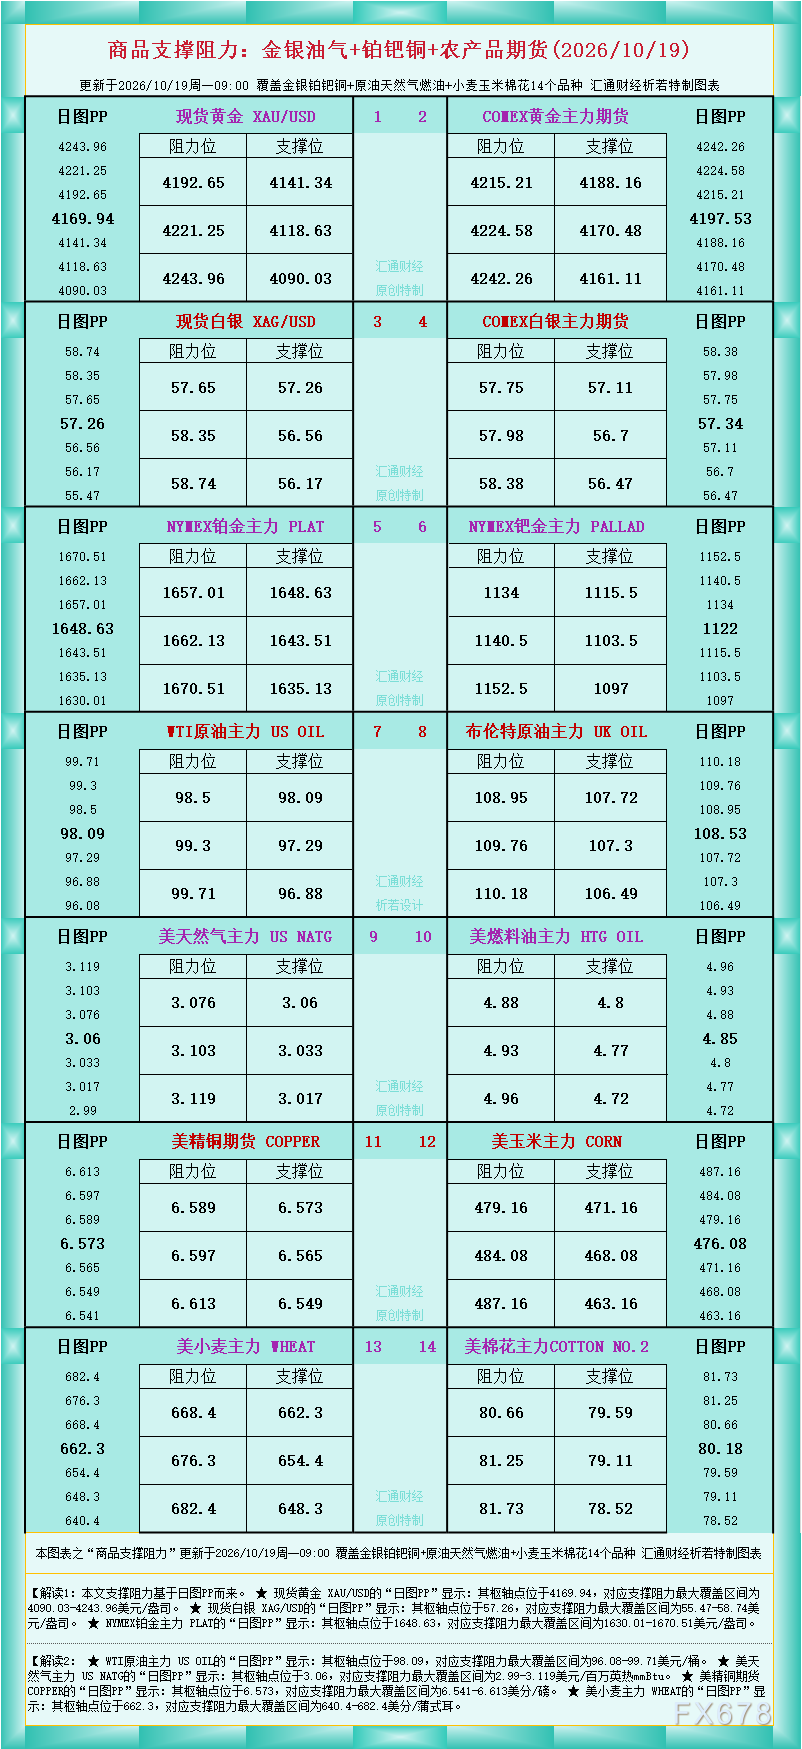
According to the data in the chart, Interpretation 1: The support and resistance in this article are based on daily chart PP.
★ Spot gold XAU/USD “Daily Chart PP” shows: its pivot point is at 4169.94, with the maximum support and resistance range from 4090.03 to 4243.96 USD/oz.
★ Spot silver XAG/USD “Daily Chart PP” shows: its pivot point is at 57.26, with the maximum support and resistance range from 55.47 to 58.74 USD/oz.
★ NYMEX platinum main contract PLAT “Daily Chart PP” shows: its pivot point is at 1648.63, with the maximum support and resistance range from 1630.01 to 1670.51 USD/oz.
Interpretation 2:
★ WTI crude oil main contract US OIL “Daily Chart PP” shows: its pivot point is at 98.09, with the maximum support and resistance range from 96.08 to 99.71 USD/barrel.
★ US natural gas main contract US NATG “Daily Chart PP” shows: its pivot point is at 3.06, with the maximum support and resistance range from 2.99 to 3.119 USD/million BTU (mmBtu).
★ US copper futures COPPER “Daily Chart PP” shows: its pivot point is at 6.573, with the maximum support and resistance range from 6.541 to 6.613 cents/pound.
★ US wheat main contract WHEAT “Daily Chart PP” shows: its pivot point is at 662.3, with the maximum support and resistance range from 640.4 to 682.4 cents/bushel.
For more varieties, see the chart for detailed analysis.
Disclaimer: The content of this article solely reflects the author's opinion and does not represent the platform in any capacity. This article is not intended to serve as a reference for making investment decisions.
You may also like
Signal of a rebound? Goldman Sachs US stock panic index reaches "extreme levels"
Goldman Sachs Volatility Panic Index surged to 9.57, approaching its maximum value, with the largest single-day increase ranking third in history, and the combined two-day volatility setting a new record. Historical data shows that after this index has exceeded the 9.5 threshold 15 times, the S&P 500 has seen an average three-month gain of 4.6% with a success rate of 80%. However, Goldman Sachs traders warn that forced liquidations have not yet fully cleared, and the market is still searching for a bottom, but opportunities on the other side are becoming increasingly difficult to ignore.

SpaceX (SPCX.US) undergoes board changes: Google executive departs, Tesla merger evaluation underway.
SpaceX (SPCX.US) announced on Friday that Don Harrison has resigned from the company's board of directors.

NEAR Price Falls 8.14% as Analyst Eyes Buys Below $3.50 Level
Crypto prices
More


