
A chart: Overview of "pivot points + long and short positions signals" for gold, crude oil, forex, and stock indices on October 7, 2026

Huitong Network, October 7 — Here is the latest “Pivot Points + Long/Short Position Signals” chart for gold, crude oil, forex, and equity indices, including both graphical and written analysis. Based on a comparison of the latest net long% and the previous day’s net long% (net long% from the last trading day), the various position signals interpreted cover a total of 13 types, including: net long increase, net long decrease, no change in net short, net short turning to balanced positions, etc. According to the actual data comparison, several of these signals are shown accordingly.
At a glance: “Pivot Points + Long/Short Position Signals” for gold, crude oil, forex, and equity indices as of October 7, 2026. The latest data released today (Wednesday, October 7, 2026) show that, as of now, there are 5 instruments in this chart that are currently in an “overbought” status (longs exceed 80%), and 1 instrument in an “oversold” status (longs under 20%). The proportion of long positions for Spot Gold XAU/USD: 87%; US Crude Oil WTI OIL: 52%; EUR/USD: 63%. For more details on the “signal changes” compared to the day before and a more comprehensive list, please see the special chart created by Huitong Finance.
Among the changes in positions, the number of instruments where net long increased: 4; net long decreased: 12; net short increased: 2; net short decreased: 3. The proportion of short positions in USD/CAD is as high as 86%. Long positions in NZD/USD reach 93%. Long positions in NZD/JPY reach 89%.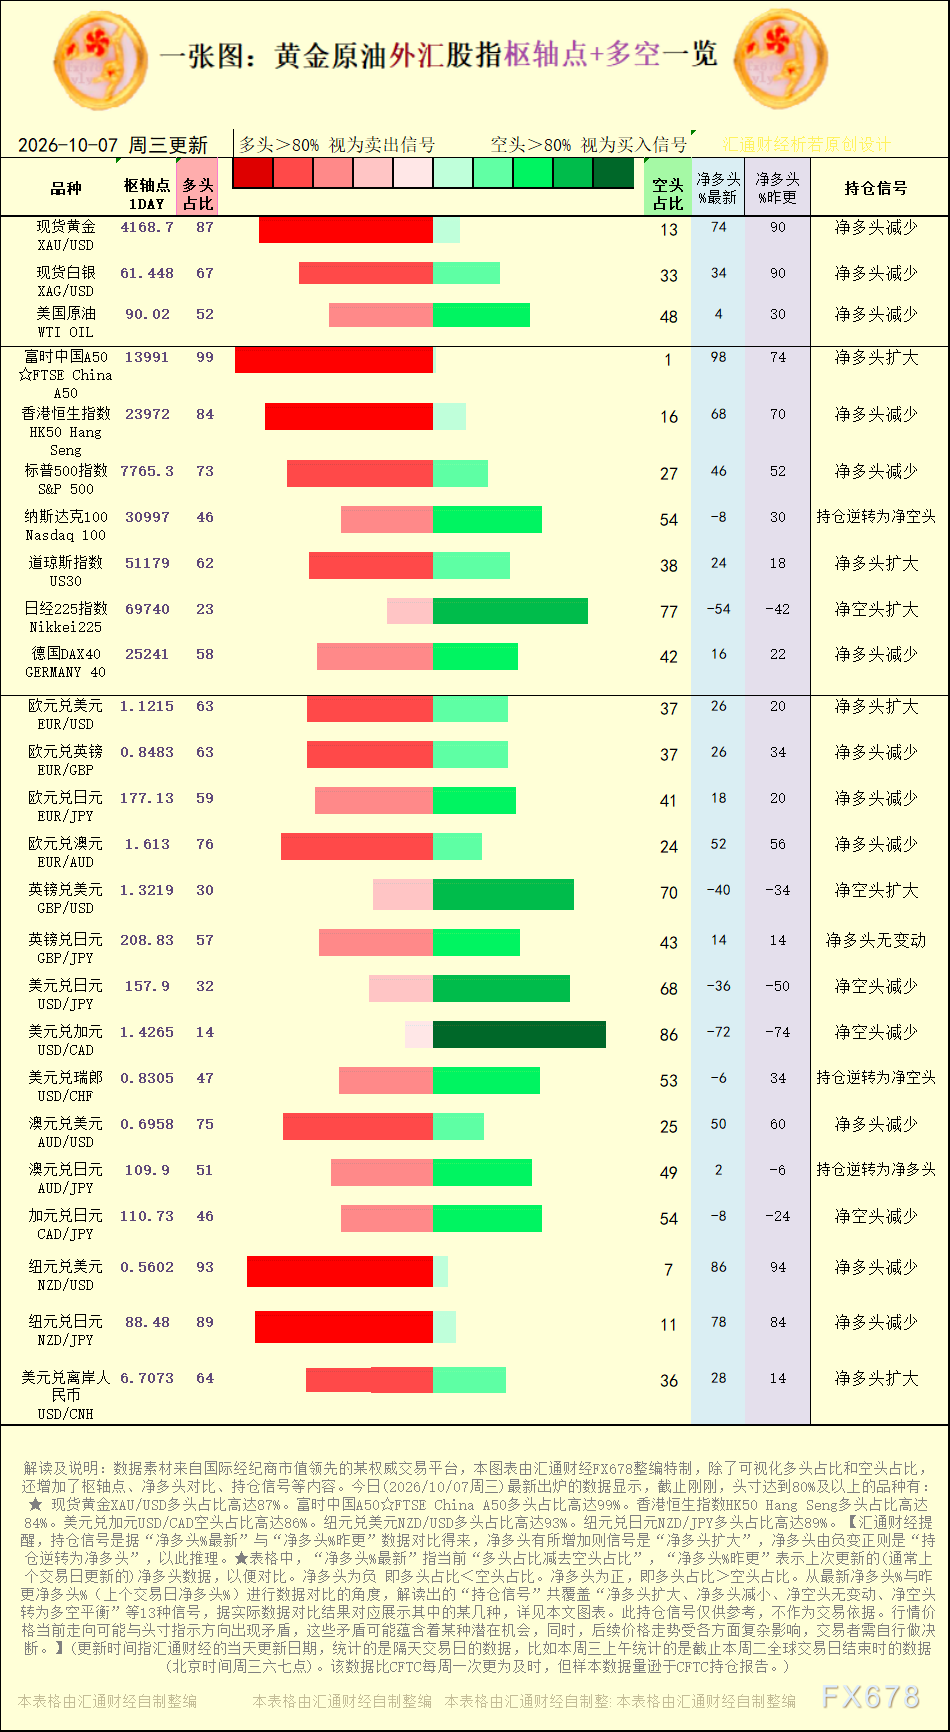
[Chart: Interpretation of pivot points and long/short position signals for gold, crude oil, forex, and equity indices, source: Special Chart by Huitong Finance. (Click the image to enlarge)]
Net short decreases were observed in: USD/JPY, USD/CAD, and CAD/JPY.
Huitong Finance reminds that position signals are determined by comparing “Latest Net Long%” and “Previous Net Long%”, where an increase in net long constitutes a “net long increase” signal, while a negative net long turning positive signals a “reversal to net long.” In the table, “Latest Net Long%” refers to the current “long proportion minus short proportion,” and “Previous Net Long%” refers to the most recent update (usually the last trading day), for comparison. A negative net long indicates that longs < shorts, while a positive net long indicates longs > shorts. Based on the comparison of the latest net long% and previous net long% (last trading day’s net long%), the interpretation covers a total of 13 types of “position signals”, such as “net long increase, net long decrease, no change in net short, net short turns to balanced positions,” etc. Actual comparison results are illustrated accordingly in this article’s chart.
Disclaimer: The content of this article solely reflects the author's opinion and does not represent the platform in any capacity. This article is not intended to serve as a reference for making investment decisions.
You may also like
Deutsche Bank made significant Q3 purchases of midstream AI application stocks: the three major cloud giants saw increased holdings, with Palantir (PLTR.US) and Salesforce (CRM.US) also favored.
Deutsche Bank has submitted its third quarter 13F holdings report for the period ending September 30, 2026.

Pendle Bridge integrates with BungeeExchange, supporting cross-chain transfers across 13 networks

Barclays significantly increased holdings in Tesla (TSLA.US) and Intel (INTC.US) in Q3, and bought Nasdaq ETF options for hedging
According to disclosures by the U.S. Securities and Exchange Commission (SEC), Barclays has submitted its third-quarter holdings report (13F) as of September 30, 2026.

Crypto prices
More


