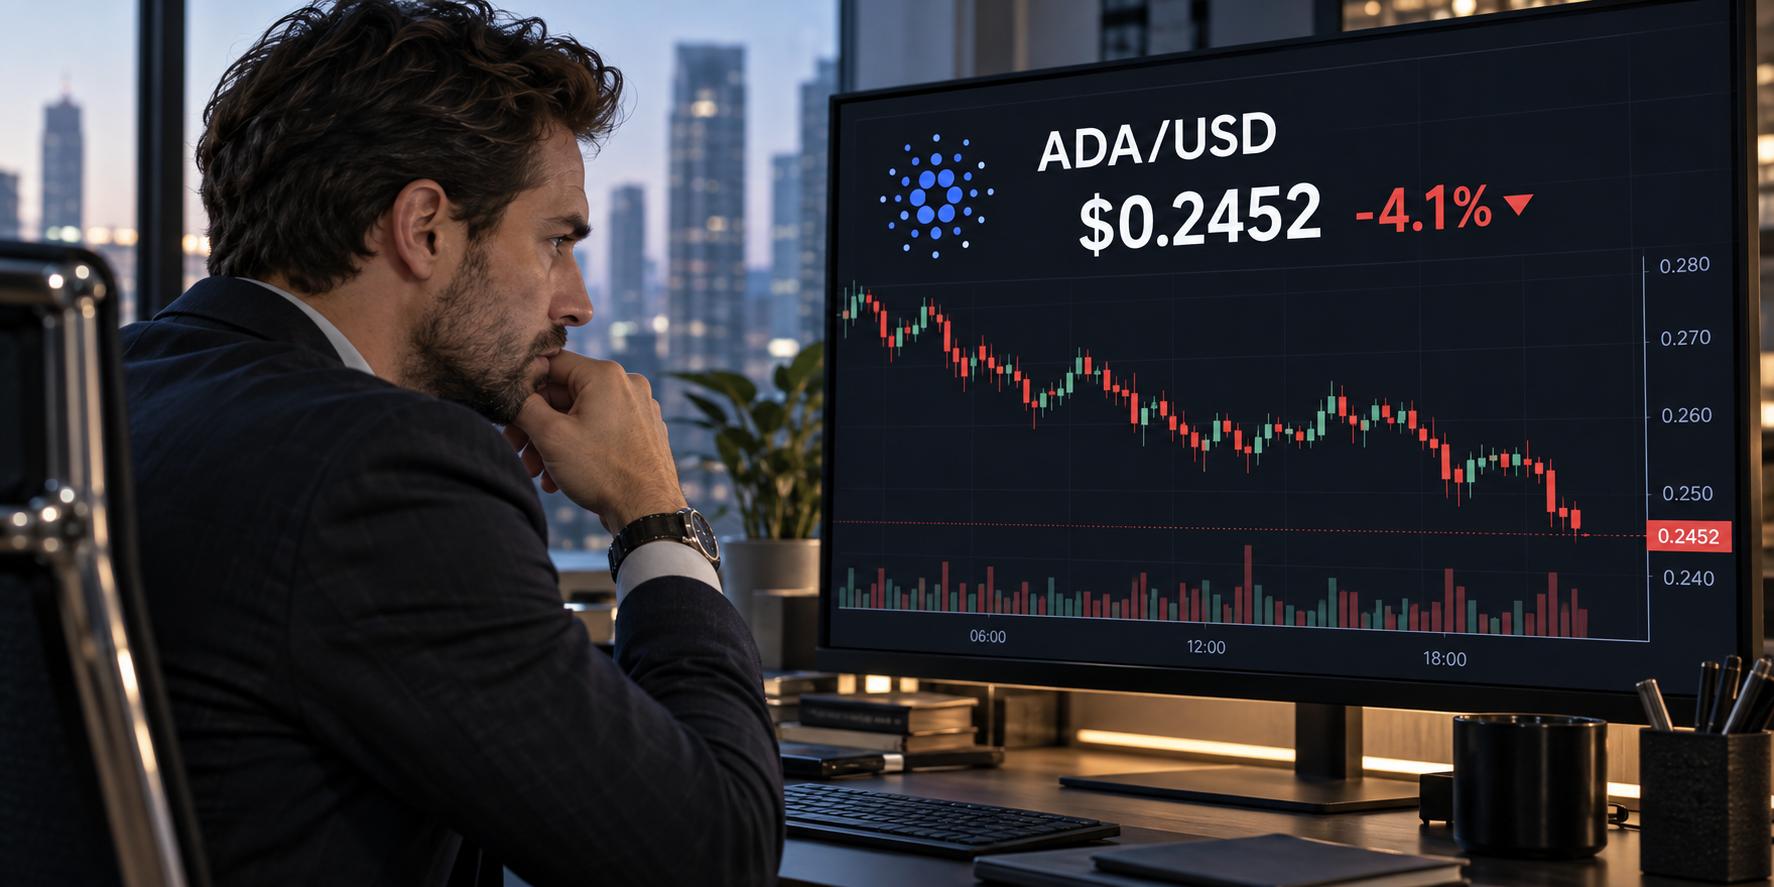
Derivatives positioning and on-chain indicators, however, show less agreement about where $ADA goes next.
The resulting picture is one of an uptrend facing a test, rather than a clear signal that another rally is underway.
Long-to-short ratio and funding rate diverge
CoinGlass data placed Cardano’s long-to-short ratio at 0.73 on Monday, close to its lowest reading in more than a month.
A reading below one indicates that short positions outnumber long positions, reflecting a cautious or bearish tilt among those traders.
Funding rates tell a different story. Cardano’s funding rate turned positive on September 17 and stood at 0.0049% on Monday.
When funding is positive, traders holding long positions pay those holding shorts. That typically indicates greater demand for leveraged exposure to potential price gains.
Taken together, the two readings suggest traders have yet to settle on a common view. Some are positioned for a decline, while others are willing to pay to maintain long exposure. Neither figure, on its own, establishes which group will be right.
The disagreement matters after an 11% weekly advance. A sharp move can attract traders betting that momentum will continue, as well as others expecting a pullback.
$ADA’s next sustained move may depend on whether fresh buying can outweigh profit-taking and new short positions.
CryptoQuant’s summary data adds to the uncertainty. Its futures market indicators show large orders from whales, alongside sell-side dominance and signs of overheating following $ADA’s recent gains.
Large orders can have an outsized effect on a market, but their presence alone does not reveal where price will go.
The sell-side and overheating readings suggest traders should watch whether supply increases as $ADA attempts to extend its rally.
CryptoQuant also flags overheating in spot markets, while other readings remain neutral.
The mix gives the data a mildly cautious tilt without showing broad agreement across all indicators.
These conditions do not erase last week’s gains.
They do, however, raise the stakes for $ADA’s nearby support levels: if buyers absorb selling around those prices, the recent advance may remain intact.
If they do not, the pullback could deepen.
$ADA holds above moving averages as $0.299 looms
Cardano’s technical position remains constructive.
At $0.2452, $ADA is above its 50-day exponential moving average (EMA) at $0.215, its 100-day EMA at $0.209, and its 200-day EMA at $0.239.
It also remains above horizontal support at $0.236.
Momentum indicators still favor buyers. The relative strength index (RSI) is near 60, while the moving average convergence divergence (MACD) line remains positive.
Both readings suggest the rally has retained momentum, although they offer no guarantee against a further pullback.
If $ADA continues to fall, the 200-day EMA near $0.239 is the first major level to watch, followed by horizontal support at $0.236.
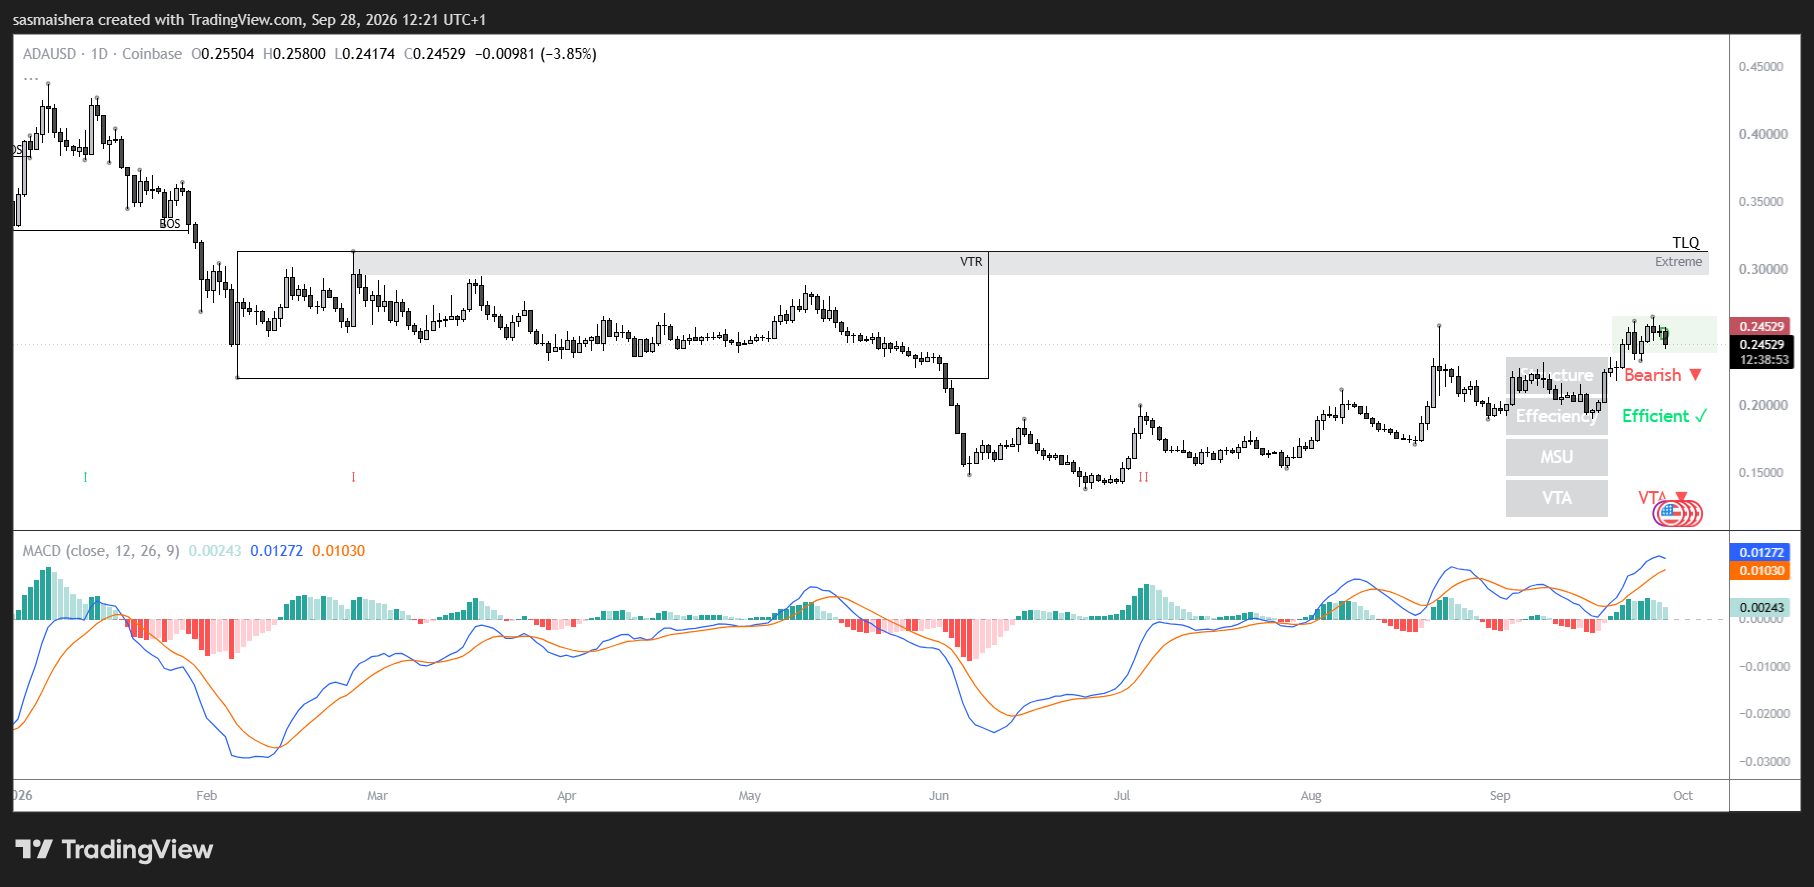
A break below both would shift attention to the 50-day EMA at $0.215 and the 100-day EMA at $0.209. Further support lies around $0.197 and, more distantly, $0.150.
On the upside, the next significant resistance level sits near $0.299. Reaching it would require $ADA to resume its climb from Monday’s consolidation.
For now, traders have a clear divide to monitor: the price chart remains positive, while positioning and on-chain data call for caution.


 invezz.com