
A chart showing commodity support and resistance: Gold, Silver, Oil, Gas + Platinum, Palladium, Copper, and Agricultural Futures (August 18, 2026)

Huitong Network, August 18—— One chart summarizes commodity support and resistance: Gold, Silver, Oil, Gas + Platinum, Palladium, Copper + Agricultural futures, updated on Tuesday, August 18, 2026, 07:25 (UTC+8). Specifically covers 14 varieties including Gold, Silver, Platinum, Palladium, Copper + Crude Oil, Natural Gas, Fuel Oil + Wheat, Corn, Cotton. For more details, refer to Huitong Finance's special chart.
One chart summarizes commodity support and resistance: Gold, Silver, Oil, Gas + Platinum, Palladium, Copper + Agricultural futures, updated on Tuesday, August 18, 2026, 07:25 (UTC+8). Specifically covers 14 varieties including Gold, Silver, Platinum, Palladium, Copper + Crude Oil, Natural Gas, Fuel Oil + Wheat, Corn, Cotton. For more details, refer to Huitong Finance's special chart.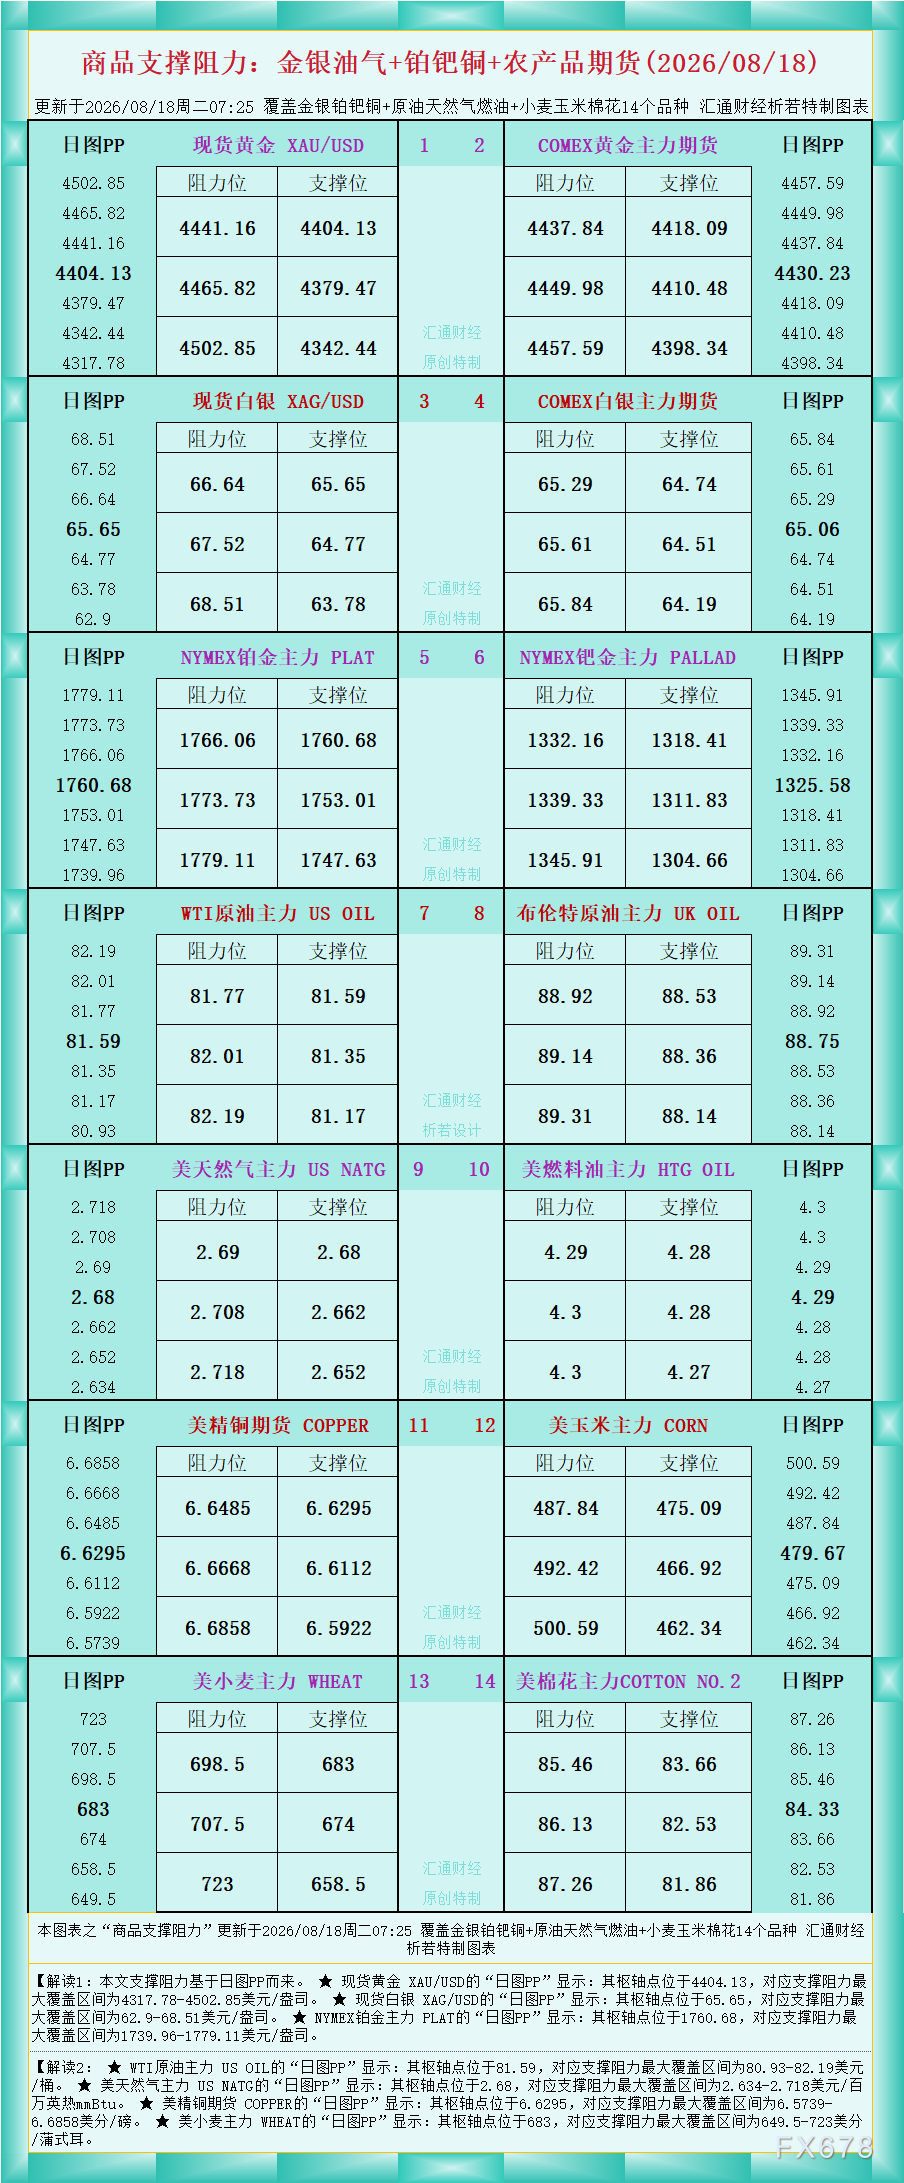
According to the chart data, Interpretation 1: The support and resistance in this article are based on the daily chart PP levels.
★ The daily chart PP for spot gold XAU/USD shows: its pivot is at 4404.13, with a maximum support and resistance range of 4317.78-4502.85 USD/oz.
★ The daily chart PP for spot silver XAG/USD shows: its pivot is at 65.65, with a maximum support and resistance range of 62.9-68.51 USD/oz.
★ The daily chart PP for NYMEX Platinum main contract PLAT shows: its pivot is at 1760.68, with a maximum support and resistance range of 1739.96-1779.11 USD/oz.
Interpretation 2:
★ The daily chart PP for WTI Crude main contract US OIL shows: its pivot is at 81.59, with a maximum support and resistance range of 80.93-82.19 USD/barrel.
★ The daily chart PP for US Natural Gas main contract US NATG shows: its pivot is at 2.68, with a maximum support and resistance range of 2.634-2.718 USD per million British thermal units (mmBtu).
★ The daily chart PP for US Copper futures COPPER shows: its pivot is at 6.6295, with a maximum support and resistance range of 6.5739-6.6858 cents/pound.
★ The daily chart PP for US Wheat main contract WHEAT shows: its pivot is at 683, with a maximum support and resistance range of 649.5-723 cents/bushel.
For interpretation of more varieties, refer to the chart.
Disclaimer: The content of this article solely reflects the author's opinion and does not represent the platform in any capacity. This article is not intended to serve as a reference for making investment decisions.
You may also like
The “outlier” in the AI capital expenditure frenzy: Apple (AAPL.US) keeps spending flat, accounting for less than 5% of sales
Apple continues to stand out among major tech peers, largely avoiding the aggressive wave of capital expenditure associated with artificial intelligence (AI) infrastructure.

Youth Employment Declines for 48 Consecutive Months: Behind the Semiconductor Boom, Young South Koreans Are Being Left Behind by the Times
In South Korea, the unemployment rate in October fell to a three-year low of 2.5%. However, the number of employed people decreased by 50,000, youth employment has declined for 48 consecutive months, and domestic demand remains weak.


Strategy (MSTR.US) Faces Potential Removal from MSCI Index, Passive Funds May Sell $2.8 Billion
MicroStrategy is expected to be removed from the MSCI Global Investable Market Index. JPMorgan estimates that passive funds may sell about $2.8 billion worth of shares, and if removed from multiple indexes simultaneously, the scale could reach up to $8.8 billion. Additionally, with BTC falling below its average cost of $75,456, the company’s stock price and financing capacity are under dual pressure.

Crypto prices
More


