
Bitcoin drops to one-week low as retail buys gold at highest prices since June

Bitcoin (BTC) headed lower around Tuesday’s Wall Street open as investors’ appetite for gold sent the precious metal to nine-week highs.
Key points:
- Bitcoin takes a backseat as gold steals the limelight climbing to $4,435 per ounce.
- Analysis eyes the Bitcoin-gold positive correlation still in place.
- Key resistance near $66,000 keeps BTC price action in check ahead of the US CPI inflation print.
Retail investors pile into gold ETFs
Data from TradingView showed BTC/USD abandoning a low-timeframe rebound to drop back below $64,000.
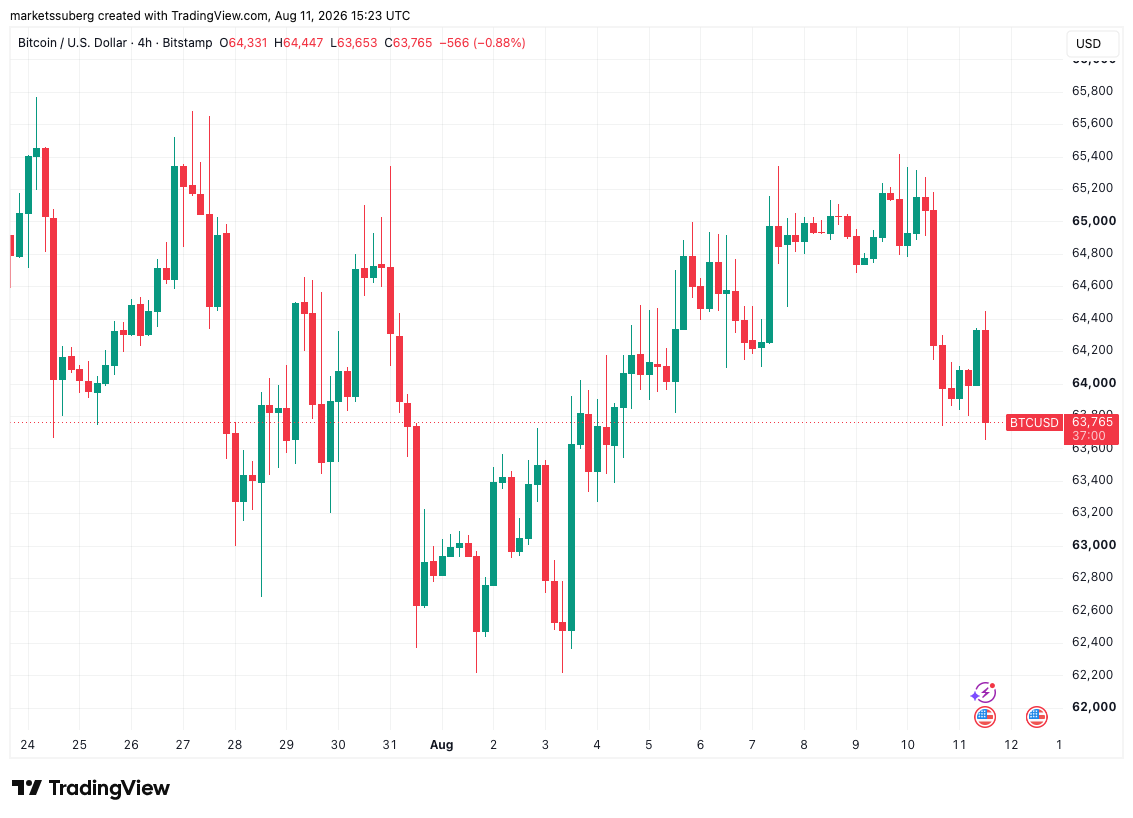
BTC/USD four-hour chart.
The pair finished down 1.5% on Monday thanks to concerns over the US-Iran war and the latest impasse over the reopening of the Strait of Hormuz oil route. US stocks tracked sideways amid a fresh 5% surge in oil prices.
As uncertainty grew, new data showed increasing demand for safe haven gold, which hit $4,435 per ounce on Tuesday, its highest level since June 5. Chinese appetites for the precious metal were already on the radar in August.
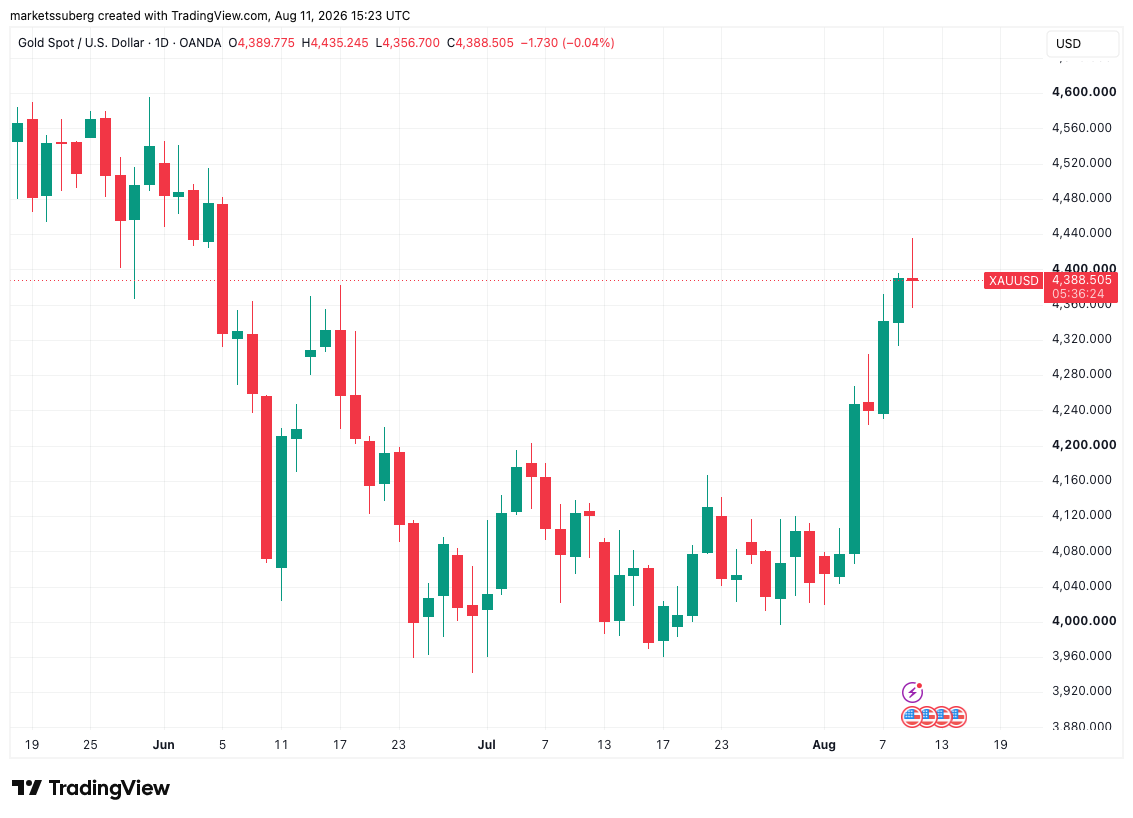
XAU/USD one-day chart.
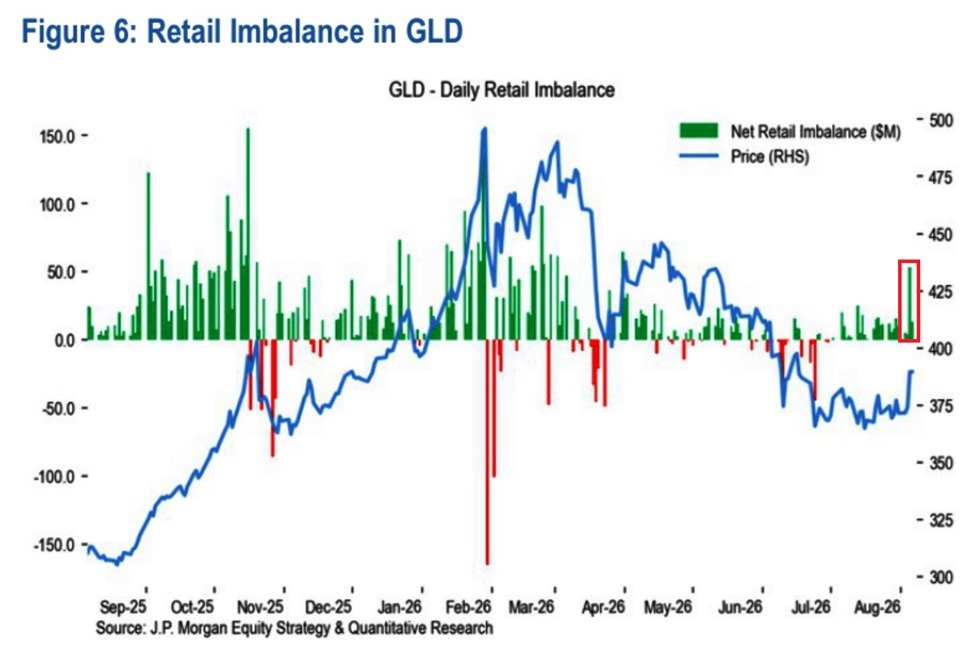
Trading resource The Kobeissi Letter highlighted particular interest from the retail sector — currently a key missing component in crypto markets. NYSE ARCA-traded SPDR Gold Shares (GLD) exchange-traded fund attracted daily retail inflows of $50 million on Aug. 5 — the highest single-day tally since mid-March for the largest US physical gold-backed ETF product. The day’s total inflow was $637 million, while the US spot Bitcoin ETFs saw a combined inflow of $244.4 million.
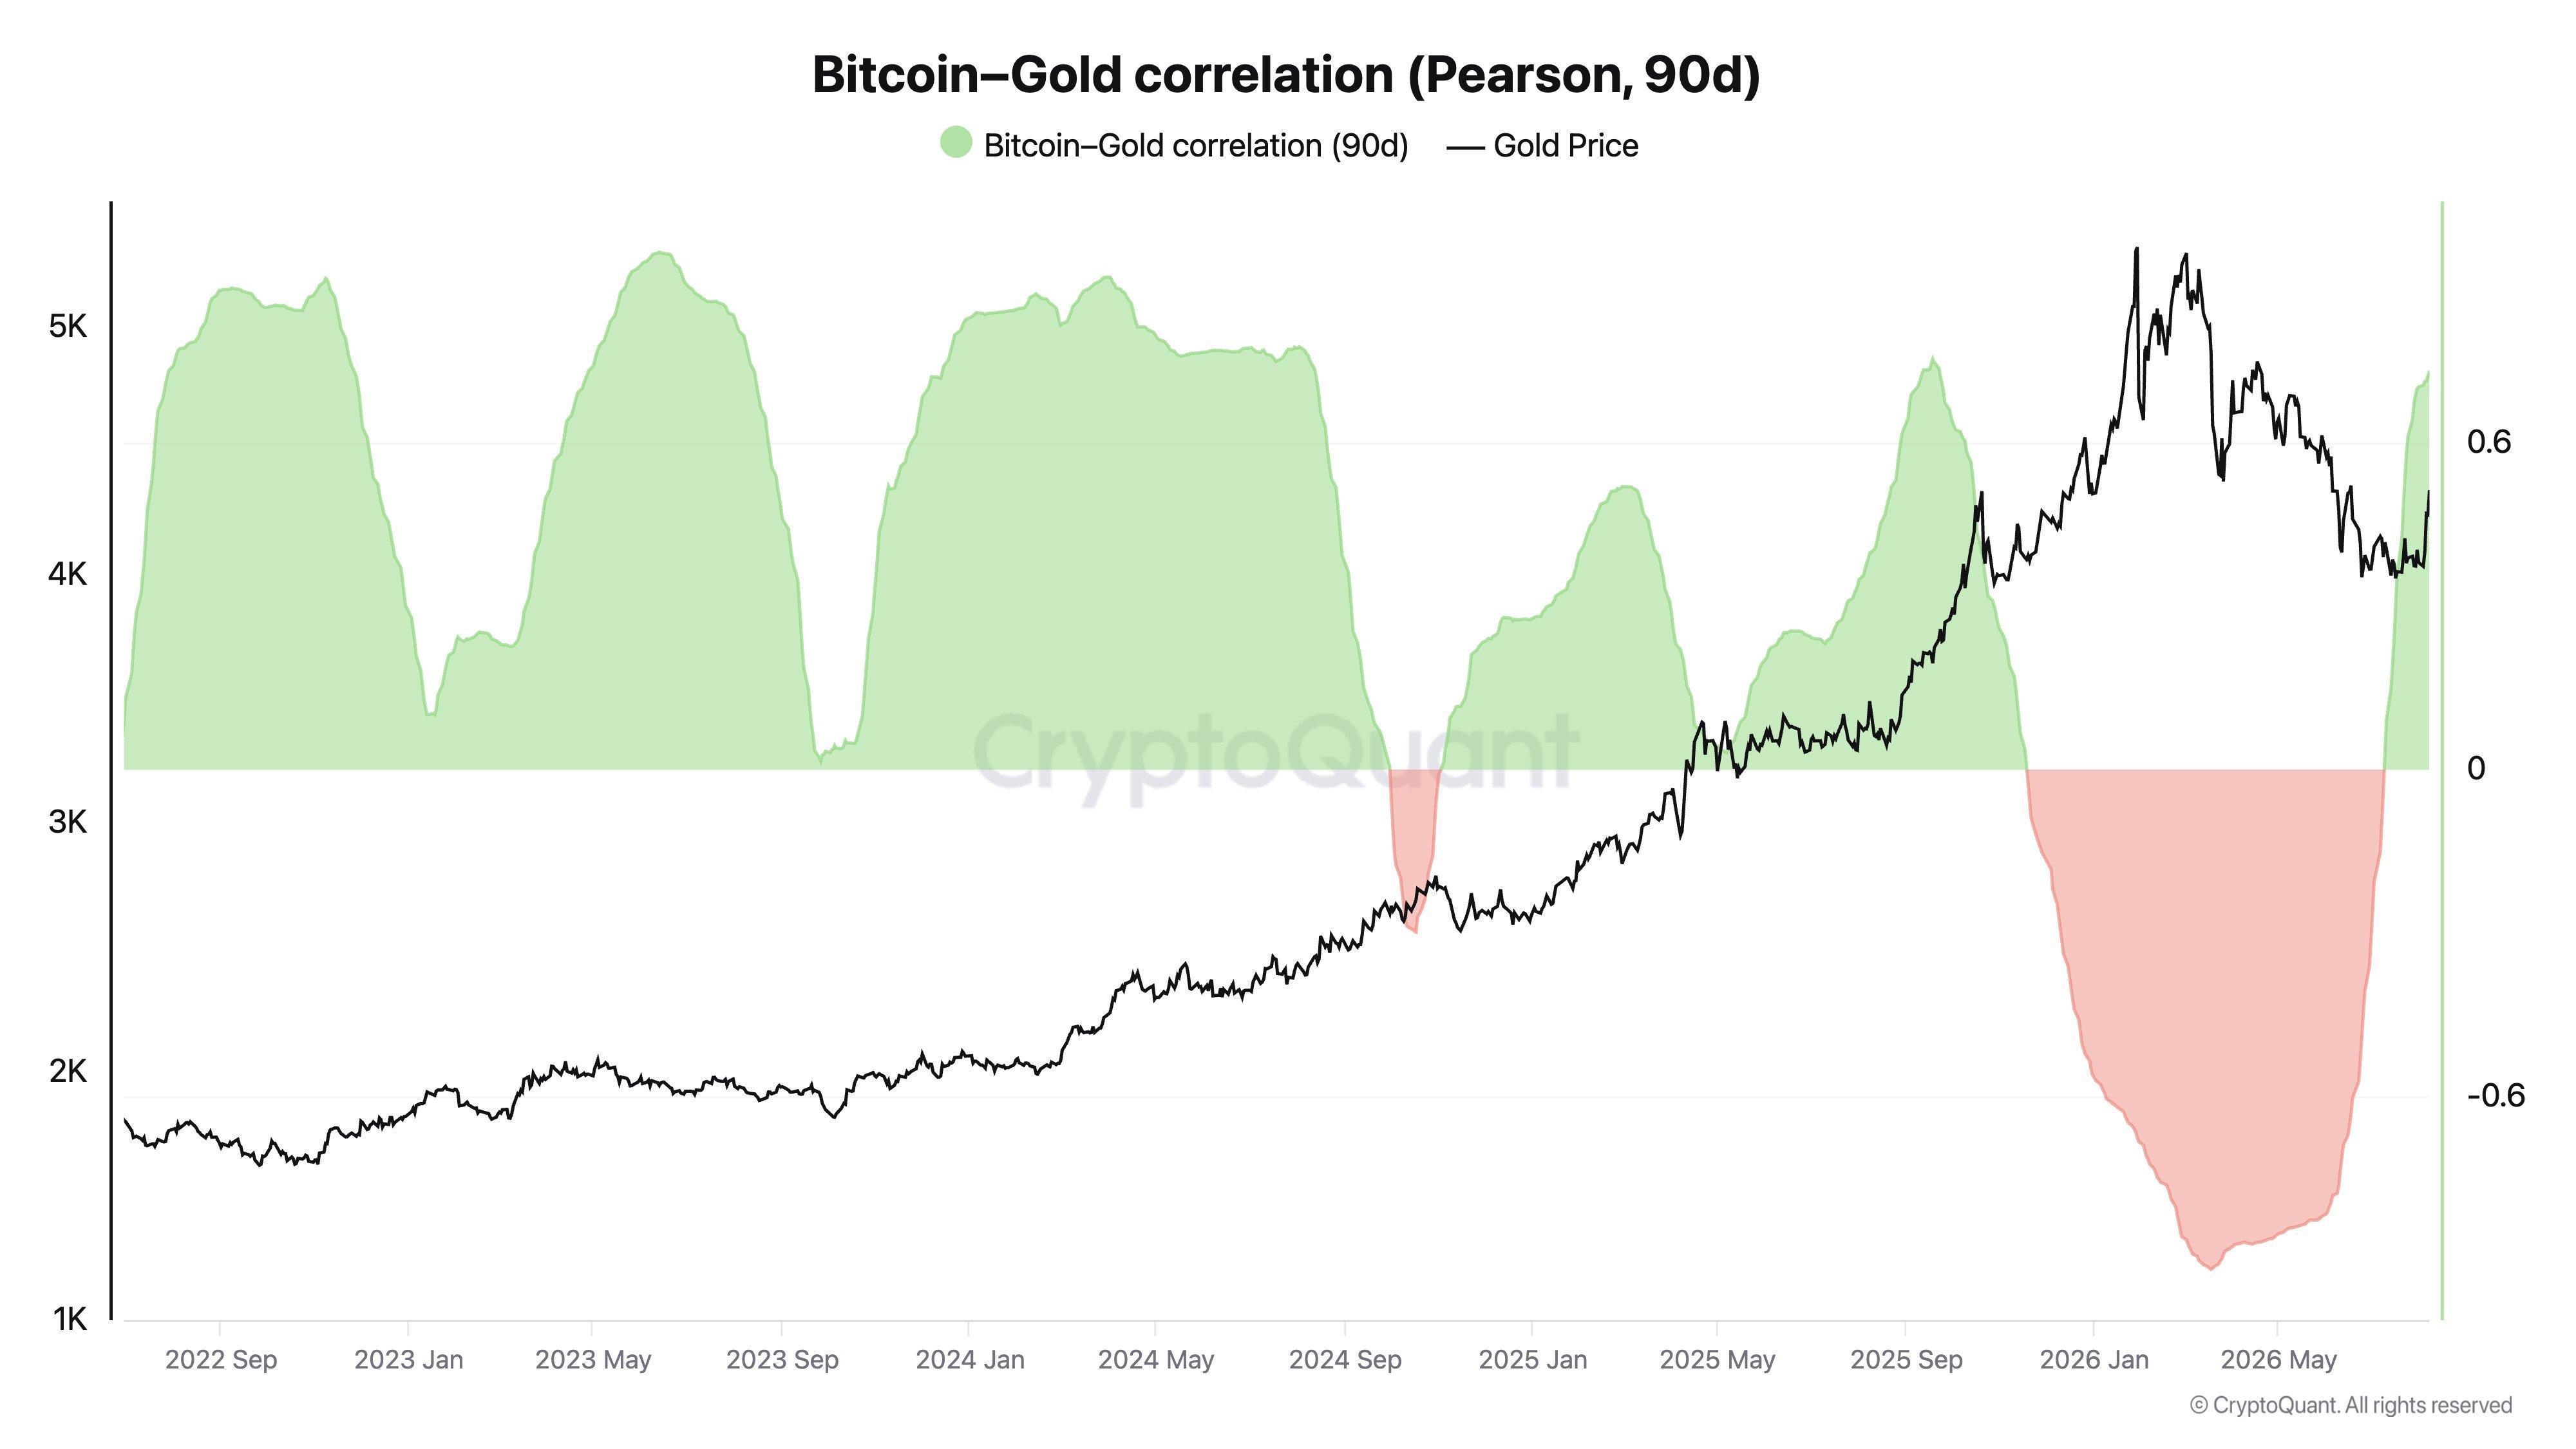
Despite lackluster August BTC price performance, the biggest crypto retained its positive correlation to gold on a 90-day rolling basis, data from onchain analytics platform CryptoQuant showed.
Related: Bitcoin sell pressure ‘closer to exhaustion’ after $4B USDT market-cap drop: CryptoQuant
Familiar BTC price resistance in place as CPI nears
Within low time frames, BTC/USD continued to be contained by a long-term trend line, the 50-month exponential moving average (EMA) at $65,827.
As Cointelegraph reported, this coincided with an area of potential short liquidations. Since the start of June, the pair has managed just three daily closes above the 50-month EMA.
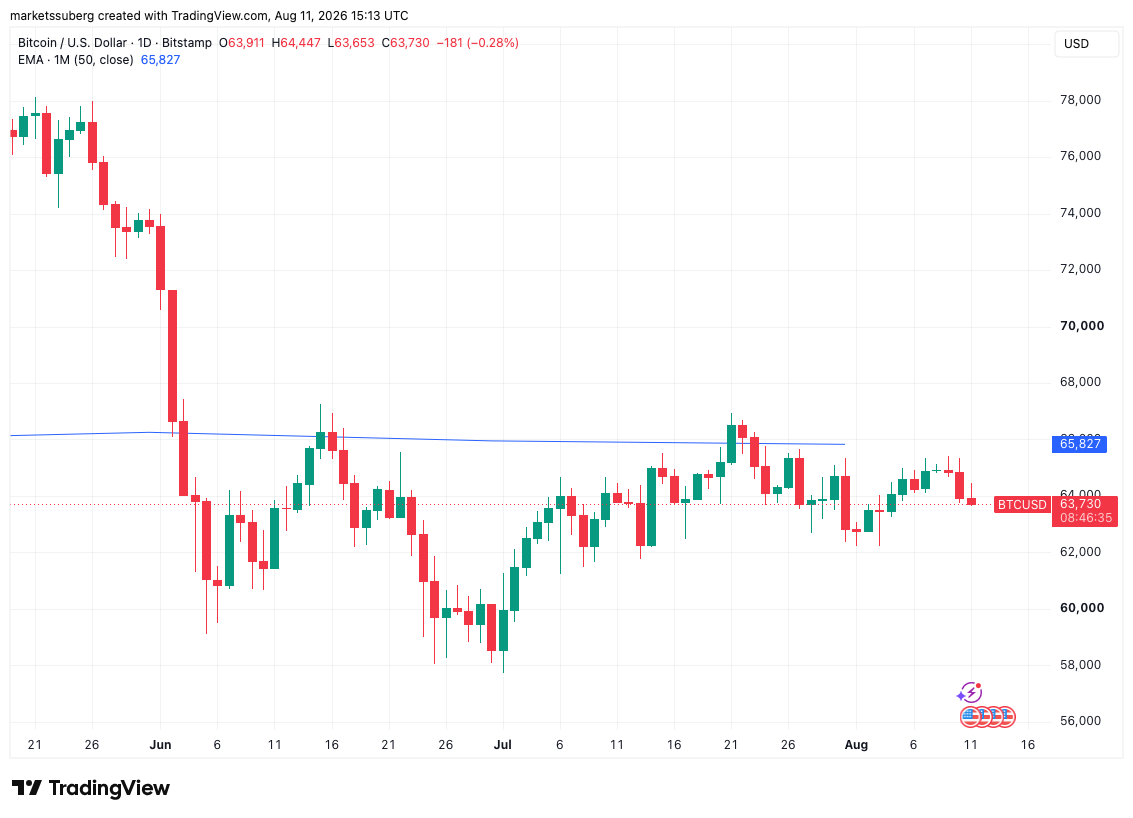
BTC/USD one-day chart with 50-month EMA.
That’s leading market participants to maintain their monitoring of the zone below $66,000 as rangebound behavior continued.
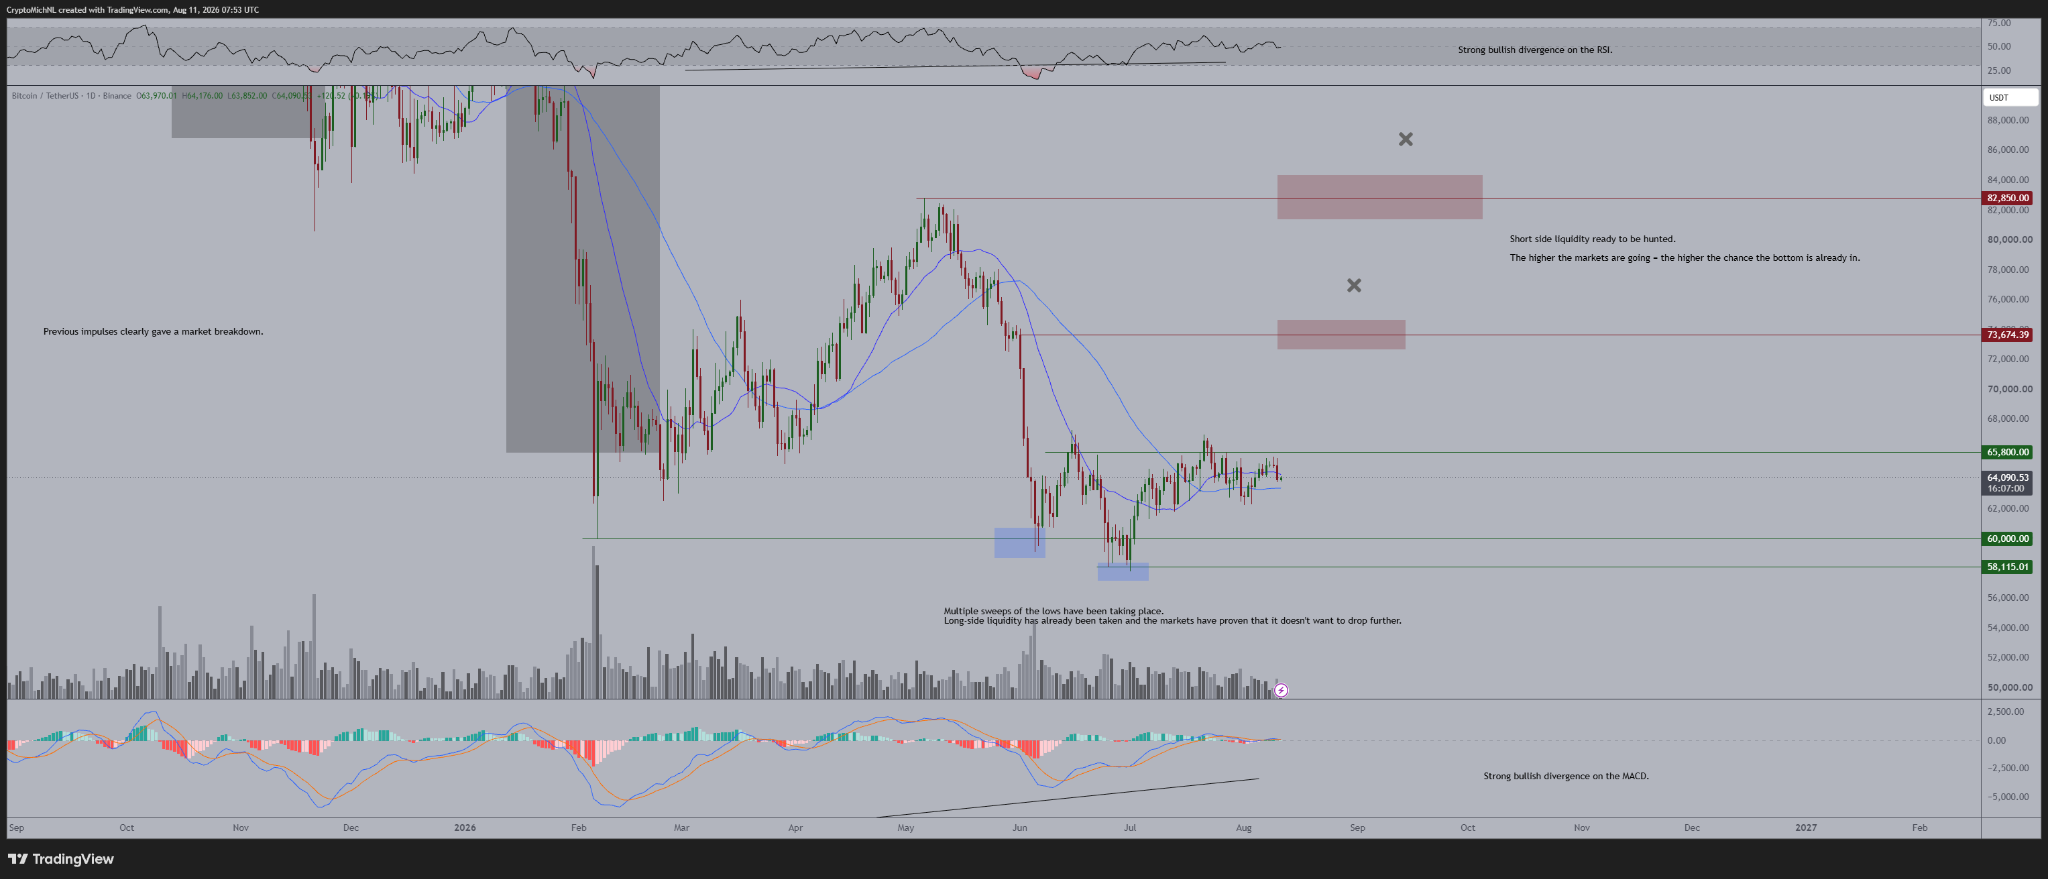
“It’s still stuck in this range, meaning that this recent correction was most likely just a liquidity grab from leveraged longs being positioned in the markets. Consolidation here, and preferably a slight bounce upwards to $64,500 would trigger that we’re not continuing the cascade,” trader and analyst Michaël van de Poppe told X followers on Tuesday.
“If there’s a breakout above $65,800, the likelihood of running to $73,000 is there.”
Wednesday sees the first of this week’s key risk-asset volatility catalysts in the form of the US Consumer Price Index (CPI) print for July. Crypto markets have historically weakened into major US inflation data releases, while July’s soft print sparked daily gains of over 4%.
Disclaimer: The content of this article solely reflects the author's opinion and does not represent the platform in any capacity. This article is not intended to serve as a reference for making investment decisions.
You may also like
AI stocks fuel global market rally, Nasdaq 100 futures jump 1.5%

Rising expectations of Fed rate hikes trigger a wave of US Treasury sell-offs! Japanese bonds follow suit, 10-year yields approach 2.8%
Due to the higher-than-expected US October CPI data, the market increased its bets that the Federal Reserve may need to take more aggressive rate hikes. US Treasury bonds were sold off on Tuesday, and Japanese government bonds followed the overnight decline in the US Treasury market on Wednesday.

U.S. inflation remains “persistently high”! Goldman Sachs changes its stance: The Federal Reserve’s rate hike cycle is not over yet, another 25 basis points increase possible in March next year
Higher-than-expected US October CPI data released on Tuesday prompted Goldman Sachs to revise its previous forecast that the Fed’s current rate hike cycle would end in December. The Wall Street financial giant now expects the Fed to raise interest rates by another 25 basis points in March next year.
Crypto prices
More


