
A Chart of Commodity Support and Resistance: Gold, Silver, Oil, Gas + Platinum, Palladium, Copper, Agricultural Futures (July 30, 2026)

Fxstreet.com July 30th News—— One chart to view commodity support and resistance: gold, silver, oil, gas + platinum, palladium, copper + agricultural futures, updated at 07:25, Thursday, July 30th, 2026 (UTC+8). Specifically covers 14 products including gold, silver, platinum, palladium, copper + crude oil, natural gas, diesel oil + wheat, corn, cotton. For more details, please refer to the exclusive chart made by Fxstreet Analysis.
One chart to view commodity support and resistance: gold, silver, oil, gas + platinum, palladium, copper + agricultural futures, updated at 07:25, Thursday, July 30th, 2026 (UTC+8). Specifically covers 14 products including gold, silver, platinum, palladium, copper + crude oil, natural gas, diesel oil + wheat, corn, cotton. For more details, see the content in Fxstreet Finance's exclusive custom chart.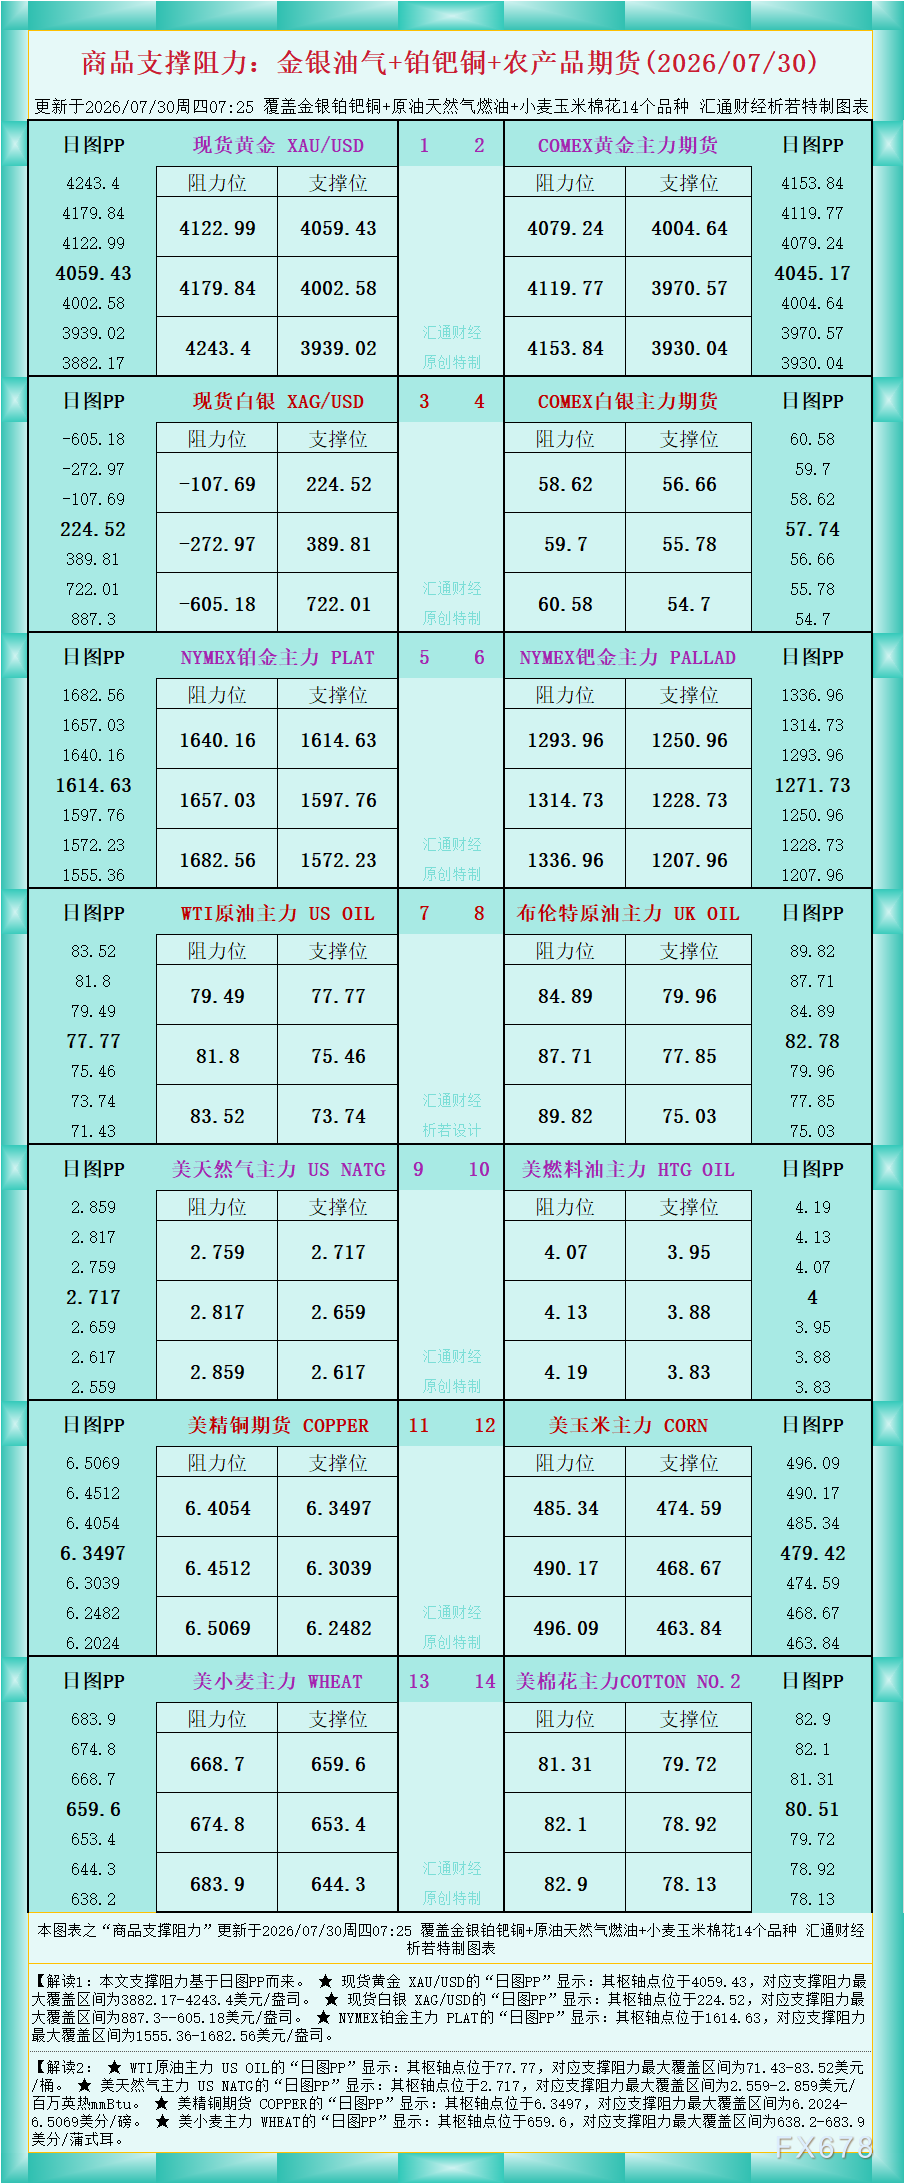
As the chart shows, Interpretation 1: The support and resistance in this article are based on the daily chart PP.
★ Spot gold XAU/USD "Daily Chart PP" shows: The pivot is at 4059.43, with a maximum support and resistance range of $3882.17-4243.4/oz.
★ Spot silver XAG/USD "Daily Chart PP" shows: The pivot is at 224.52, with a maximum support and resistance range of $887.3--605.18/oz.
★ NYMEX Platinum Main Contract PLAT "Daily Chart PP" shows: The pivot is at 1614.63, with a maximum support and resistance range of $1555.36-1682.56/oz.
Interpretation 2:
★ WTI crude oil main contract US OIL "Daily Chart PP" shows: The pivot is at 77.77, with a maximum support and resistance range of $71.43-83.52/barrel.
★ US natural gas main contract US NATG "Daily Chart PP" shows: The pivot is at 2.717, with a maximum support and resistance range of $2.559-2.859 per million British thermal units (mmBtu).
★ US copper futures COPPER "Daily Chart PP" shows: The pivot is at 6.3497, with a maximum support and resistance range of 6.2024-6.5069 cents/pound.
★ US wheat main contract WHEAT "Daily Chart PP" shows: The pivot is at 659.6, with a maximum support and resistance range of 638.2-683.9 cents/bushel.
For interpretations of more products, refer to the chart. Original custom-made by Fxstreet Finance, all rights reserved.
Disclaimer: The content of this article solely reflects the author's opinion and does not represent the platform in any capacity. This article is not intended to serve as a reference for making investment decisions.
You may also like
Cardano Foundation unveils zero-knowledge series as ADA drops 2.8% to $0.1725

How much CPO demand will Nvidia Rubin Ultra generate? Bernstein: Optical value per Pod will increase fivefold
Bernstein believes that the co-packaged optics (CPO) and fiber demand driven by Nvidia's Rubin Ultra architecture will surge significantly, with the optical content per Pod rising from $1 million to $5.4 million. This will propel the size of Nvidia's optical ecosystem market to $46.8 billion by 2028 (a 91% annual increase). Although the industry faces supply bottlenecks with InP substrates, the outlook remains positive. The institution reiterates its “outperform” rating for Lumentum, Coherent, and Ciena.

Crypto prices
More


