Bitget App
Trade smarter
Buy cryptoMarketsTradeFuturesStocksEarnInstitutionAI & More
PEPE rebounds 26% in July – Should traders expect more upside?

PEPE rebounds 26% in July – Should traders expect more upside?

AMBCryptoAMBCrypto2026/07/12 08:03
By:AMBCrypto

Pepe [PEPE] has rallied by 9.77%, from $0.00000256 to $0.00000281, since the 9th of July. This bounce was within the larger bounce that began on the 1st of July and has taken the popular memecoin up 26% so far.

The trading volume in the past 24 hours has fallen by 47%, suggesting that the flurry of activity to end the weekend has begun to fade. Weekends generally see reduced trading volume, which can sometimes lead to heightened volatility.

Here’s what traders can expect from PEPE in July.

@media only screen and (min-width: 0px) and (min-height: 0px) { div[id^="bsa-zone_1774359638628-7_123456"] { min-height: 50px; transition: min-height 0.3s ease; } } @media only screen and (min-width: 640px) and (min-height: 0px) { div[id^="bsa-zone_1774359638628-7_123456"] { min-height: 90px; } }
AD

PEPE bounce has the potential to go much higher
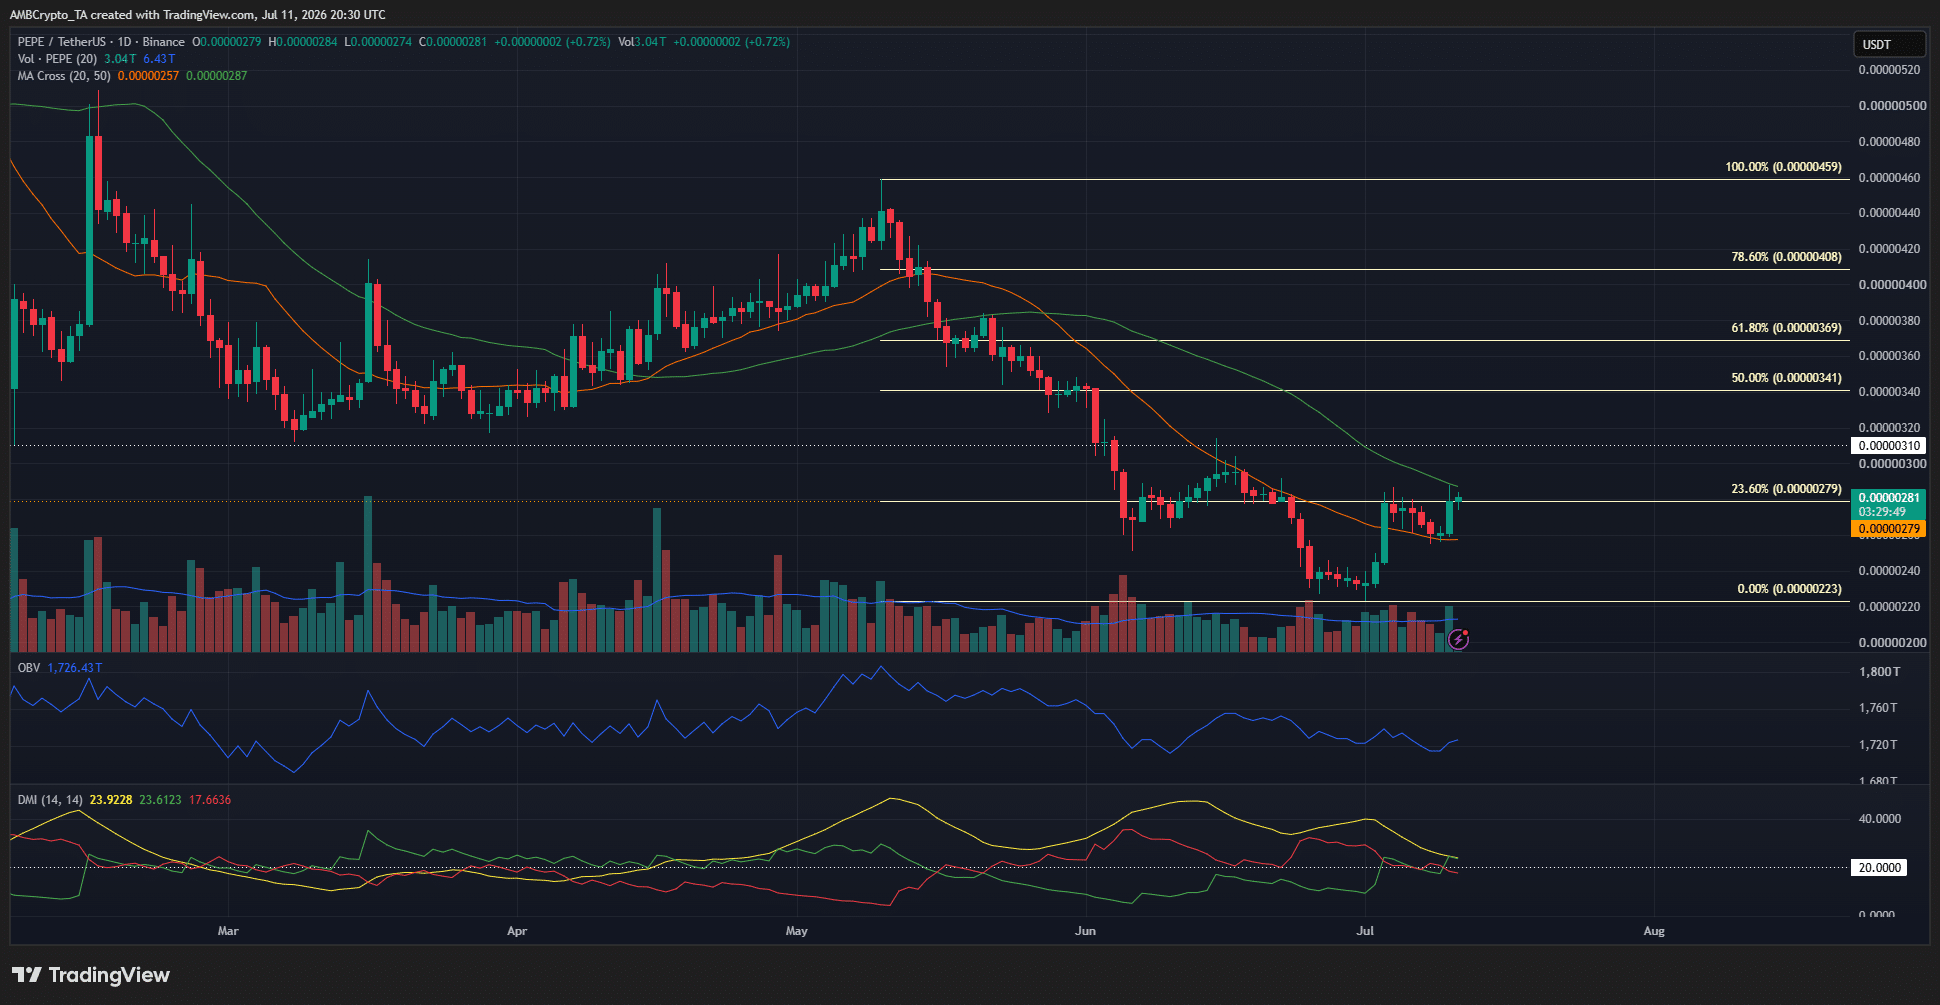
PEPE rebounds 26% in July – Should traders expect more upside? image 0 Source: PEPE/USDT on TradingView

The Directional Movement Index saw the +DI climb above 20, and the ADX was also above 20. Together, they signaled that an uptrend was taking shape.

Yet, the price action on the 1-day chart was bearish. The swing structure was bearish; the memecoin was setting new lows and lower highs. Zooming out, we can observe that this has been the case since January 2025.

Even extended rallies, such as the 185% move from April to May 2025 or the 82.4% rally in four days in January 2026, have come within this broader bearish context.

The price was right below the 50-day Moving Average, testing it as a dynamic resistance. The OBV has struggled to make new highs since May, signaling a lack of buying pressure in the market.

If the 23.6% Fibonacci retracement level at $0.0000028 can be flipped to support, like in mid-June, there would be some chance for PEPE bulls.

Should traders sell PEPE now?
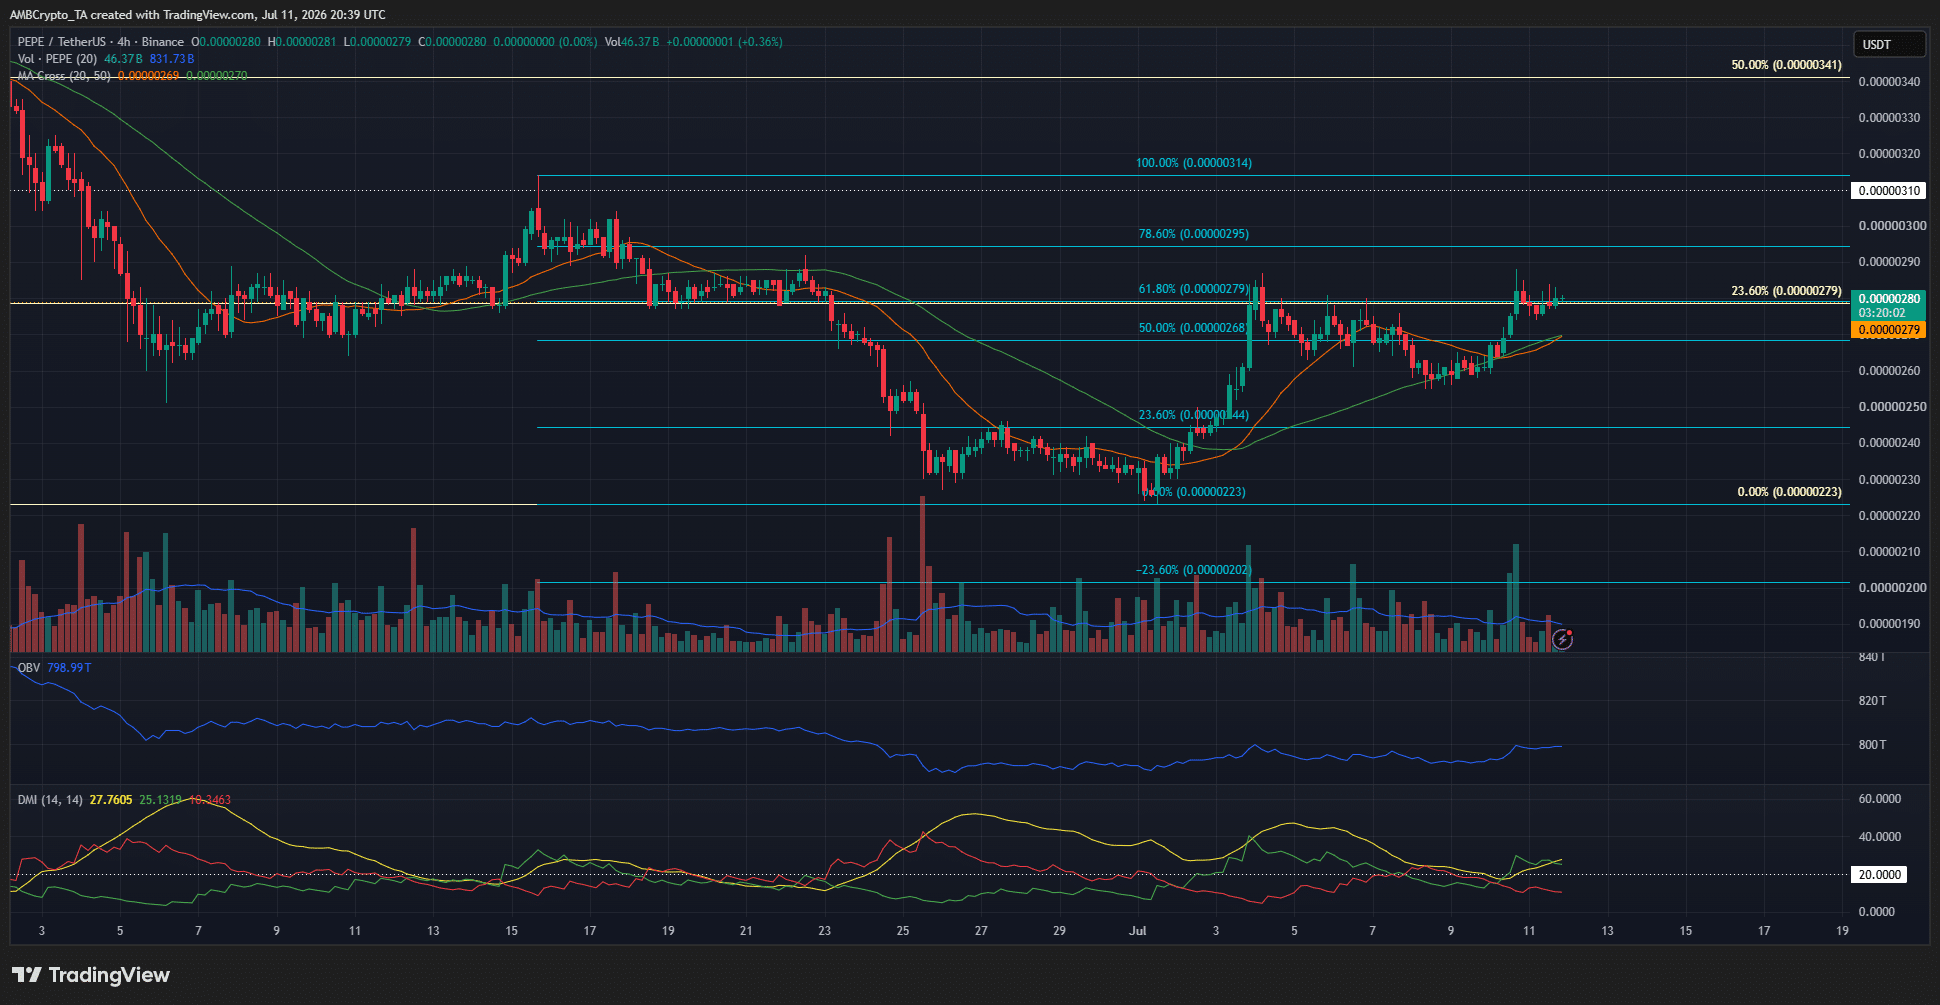
PEPE rebounds 26% in July – Should traders expect more upside? image 1 Source: PEPE/USDT on TradingView

Based on the 4-hour timeframe’s swing structure, another set of Fibonacci retracement levels (cyan) was plotted. They showed that the 78.6% retracement level at $0.00000295 was a key resistance to watch out for.

Swing traders should expect the current bounce to end around the $0.0000030 resistance zone. This bearish idea would be invalidated upon an H4 session close above the $0.00000314 swing high.

Final Summary

  • The PEPE price action was bearish in the higher timeframes, but there is potential for a sharp bounce.
  • As things stand, the $0.0000030 area is likely to see the bearish trend take control once more.

0
0

Disclaimer: The content of this article solely reflects the author's opinion and does not represent the platform in any capacity. This article is not intended to serve as a reference for making investment decisions.

Understand the market, then trade.
Bitget offers one-stop trading for cryptocurrencies, stocks, and gold.
Trade now!

You may also like

Wall Street giants collectively raise rate hike forecasts, US Treasury futures continue to fall, gold drops over 1% to break 4000

After the US October CPI exceeded expectations, Goldman Sachs and Nomura added a forecast for an interest rate hike in March next year, while Deutsche Bank included a forecast for a rate hike in January next year. Currently, the market has fully priced in a 25 basis point rate hike in December, with a 13% probability for a 50 basis point hike. On Wednesday, the US Treasury spot market was closed, but Treasury futures continued to fall, with corresponding yields rising by about 2 to 4 basis points, and spot gold came under pressure, dropping by 1.1%.

华尔街见闻•2026/11/11 21:18
Wall Street giants collectively raise rate hike forecasts, US Treasury futures continue to fall, gold drops over 1% to break 4000

No Need to Worry About the Cooling Down of AI Data Center Construction? The US Import Boom Is Unlikely to Subside in the Short Term, Real Impact May Come in 2029

It takes an average of 4.8 years from finalizing investment to starting construction of a data center project, and an additional 2.6 years from construction start to becoming operational. Servers usually cannot be installed until after the building structure and racks are completed. For trade partners such as Taiwan (China), South Korea, and Mexico who rely on US data center supply chain demand, the inertia in construction timelines provides at least a one- to two-year buffer for future exports.

华尔街见闻•2026/11/11 21:18
No Need to Worry About the Cooling Down of AI Data Center Construction? The US Import Boom Is Unlikely to Subside in the Short Term, Real Impact May Come in 2029

Federal Reserve Major Debate: When Should the Tenure of “Number Three” Williams End?

The main point of contention is whether Williams should step down in June 2028, upon completing a full 10-year term, or in June 2027, when he reaches the mandatory retirement age of 65. Analysts point out that the Federal Reserve Board holds ultimate discretion; if he leaves early, Fed Chair Waller would be able to assert greater control over the appointment to this critical position. However, forcing Williams to shorten his term could easily be interpreted as political manipulation. Williams himself is expected to serve until June 2028.

华尔街见闻•2026/11/11 21:18
Federal Reserve Major Debate: When Should the Tenure of “Number Three” Williams End?

