Bitget App
Trade smarter
Buy cryptoMarketsTradeFuturesStocksEarnInstitutionAI & More
Cash Cat Price Prediction: Is CASHCAT’s 355% OI Spike the Start of Something or the Top

Cash Cat Price Prediction: Is CASHCAT’s 355% OI Spike the Start of Something or the Top

CoinEditionCoinEdition2026/07/11 11:12
By:CoinEdition

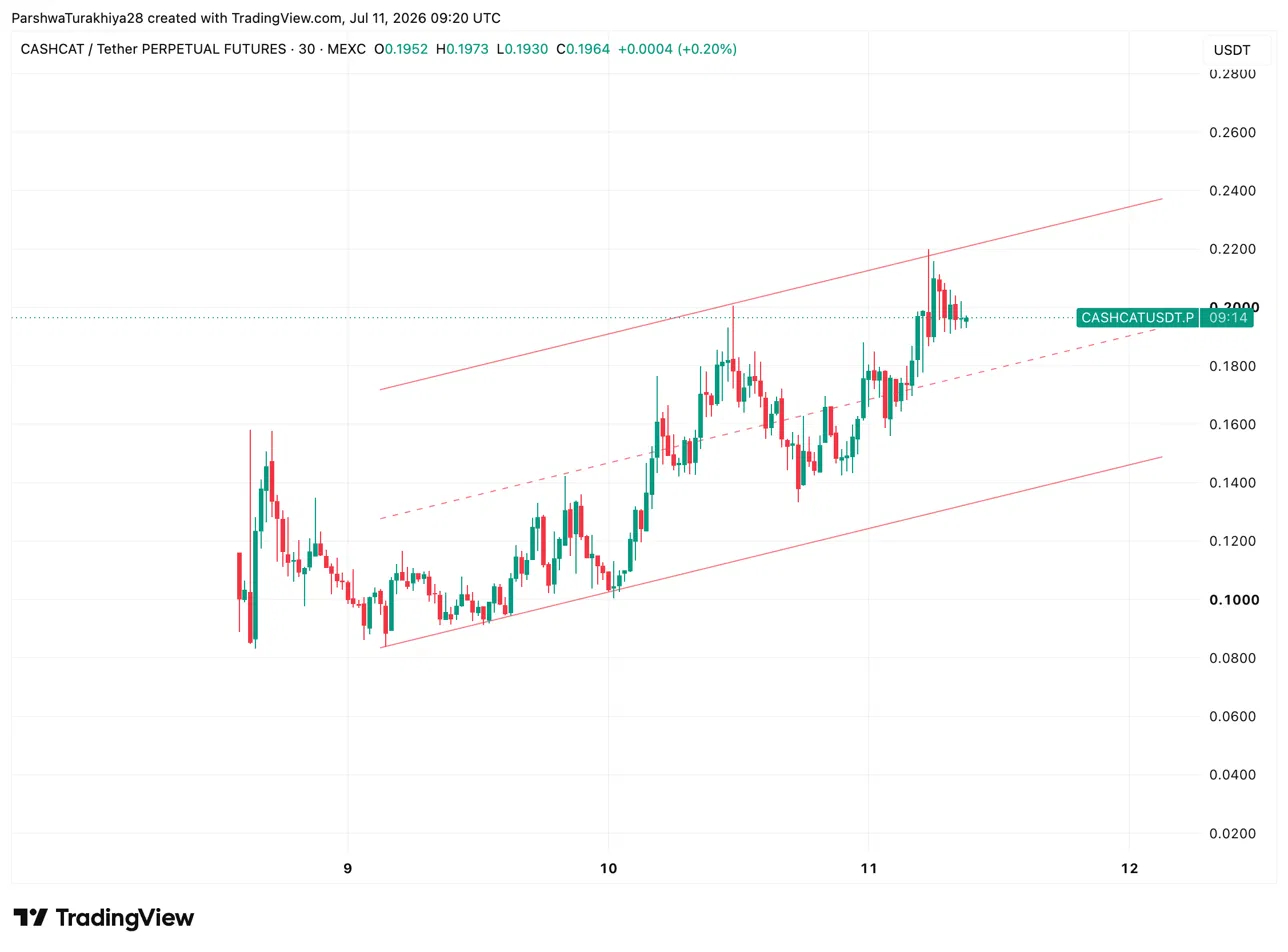
Cash Cat trades at $0.1964 on July 11, up 0.20%, consolidating inside a steep ascending channel after a parabolic run that produced some of the most extreme return stories in recent meme coin history.
Cash Cat Price Prediction: Is CASHCAT’s 355% OI Spike the Start of Something or the Top image 0

The 30-minute chart shows CASHCAT inside a steep ascending channel since July 9, with a brief spike above the upper boundary on July 11 reaching $0.2200 before pulling back. Price is now consolidating near $0.1964 with the channel floor rising toward $0.1600 as the level to hold.

  • Support at the channel lower trendline near $0.1600 and the $0.1930 intraday low
  • Resistance at the upper channel boundary near $0.2200 and the spike high at $0.2200
Cash Cat Price Prediction: Is CASHCAT’s 355% OI Spike the Start of Something or the Top image 1

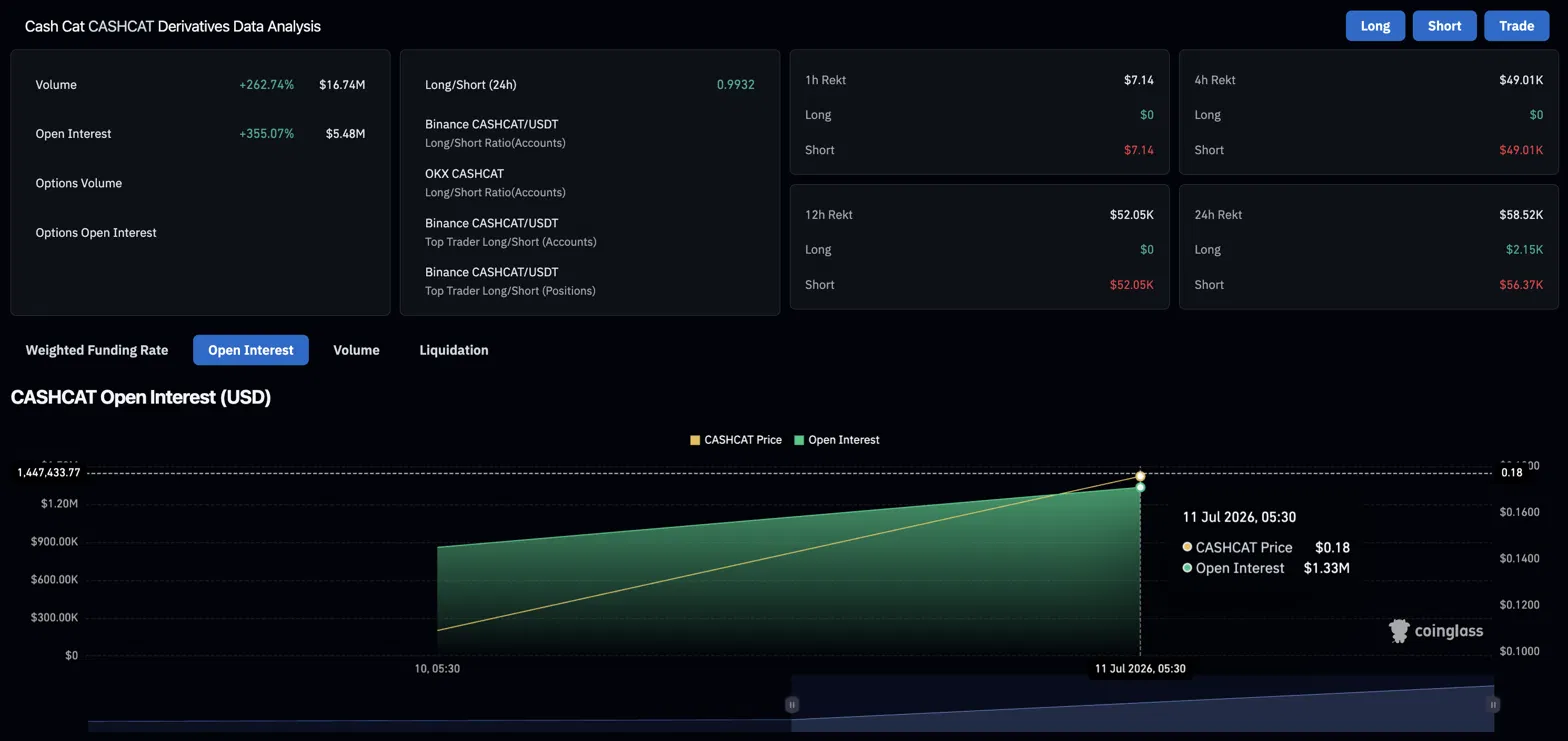
Derivatives volume jumped 262.74% to $16.74M while open interest surged 355.07% to $5.48M. Both rising sharply together means new leveraged money is flooding in rather than existing positions being recycled. The OI chart shows a near-vertical climb from July 10 to July 11; the entire derivatives market for CASHCAT was built in 48 hours.

Liquidations tell a one-sided story. Over 24 hours, $56.37K in shorts were wiped against just $2.15K for longs. Over 12 hours, $52.05K in shorts were liquidated against zero for longs. Every timeframe shows shorts getting punished with no long-side damage, meaning traders who bet against the rally are getting squeezed out at every level.

Robinhood CEO Vlad Tenev posted on X that while Robinhood Chain is being built for real-world assets, “it works great for memes too.” That single comment redirected meme-coin traders’ attention toward Robinhood Chain’s meme-coin ecosystem, where CASHCAT had already emerged as the network’s most recognized token. 

The price surge also brought attention to several early CASHCAT investors who generated massive returns. One trader spent $85 buying 17.4 million CASHCAT tokens on June 18, before the mainnet launch, and held through the run to a paper value of $2.3M at recent prices. 

Another spent $838 and turned it into $1.05M. A third put in $86 and hit $1.6M. In each case, the tokens were bought during the early low-liquidity phase when CASHCAT was trading at fractions of a cent. 

These stories have created their own momentum. Social media coverage of the wins pulled in a new wave of buyers, which is a defining characteristic of meme coin cycles and also what makes them difficult to time.

Related:

  • Upside case: The ascending channel holds, shorts continue to get squeezed, and CASHCAT retests the $0.2200 spike high on its way toward the upper channel boundary near $0.2400.
  • Downside case: The channel floor near $0.1600 breaks under profit-taking from early holders, and CASHCAT retraces sharply as the meme coin narrative rotates to the next new token on Robinhood Chain.

div#ce-iframe-ads div#frame { margin: auto; text-align: center; }
0
0

Disclaimer: The content of this article solely reflects the author's opinion and does not represent the platform in any capacity. This article is not intended to serve as a reference for making investment decisions.

Understand the market, then trade.
Bitget offers one-stop trading for cryptocurrencies, stocks, and gold.
Trade now!

You may also like

Wall Street giants collectively raise rate hike forecasts, US Treasury futures continue to fall, gold drops over 1% to break 4000

After the US October CPI exceeded expectations, Goldman Sachs and Nomura added a forecast for an interest rate hike in March next year, while Deutsche Bank included a forecast for a rate hike in January next year. Currently, the market has fully priced in a 25 basis point rate hike in December, with a 13% probability for a 50 basis point hike. On Wednesday, the US Treasury spot market was closed, but Treasury futures continued to fall, with corresponding yields rising by about 2 to 4 basis points, and spot gold came under pressure, dropping by 1.1%.

华尔街见闻•2026/11/11 21:18
Wall Street giants collectively raise rate hike forecasts, US Treasury futures continue to fall, gold drops over 1% to break 4000

No Need to Worry About the Cooling Down of AI Data Center Construction? The US Import Boom Is Unlikely to Subside in the Short Term, Real Impact May Come in 2029

It takes an average of 4.8 years from finalizing investment to starting construction of a data center project, and an additional 2.6 years from construction start to becoming operational. Servers usually cannot be installed until after the building structure and racks are completed. For trade partners such as Taiwan (China), South Korea, and Mexico who rely on US data center supply chain demand, the inertia in construction timelines provides at least a one- to two-year buffer for future exports.

华尔街见闻•2026/11/11 21:18
No Need to Worry About the Cooling Down of AI Data Center Construction? The US Import Boom Is Unlikely to Subside in the Short Term, Real Impact May Come in 2029

Federal Reserve Major Debate: When Should the Tenure of “Number Three” Williams End?

The main point of contention is whether Williams should step down in June 2028, upon completing a full 10-year term, or in June 2027, when he reaches the mandatory retirement age of 65. Analysts point out that the Federal Reserve Board holds ultimate discretion; if he leaves early, Fed Chair Waller would be able to assert greater control over the appointment to this critical position. However, forcing Williams to shorten his term could easily be interpreted as political manipulation. Williams himself is expected to serve until June 2028.

华尔街见闻•2026/11/11 21:18
Federal Reserve Major Debate: When Should the Tenure of “Number Three” Williams End?