
The "Tragedy" of Precious Metals Liquidity

Since the beginning of this year, precious metals have shown a noticeably weaker trend. Recently, after breaking below the annual line, there have been further signs of accelerated decline. Along with fellow market colleagues, I have attempted to explain the interim fluctuations of precious metals through factors such as central bank gold purchases, the breakdown and return of the US dollar credit system, and others.
Admittedly, these factors have some explanatory power for the short-term movements of precious metals. However, I am also well aware that they are obviously insufficient to convincingly explain the weakening of precious metals’ trend lines. Therefore, in this article, I aim to share my own understanding of the trajectory of precious metals from the perspective of liquidity.
Extending the view to the medium term, such as over the past two years, the performance of precious metals has shown a strong correlation with the 10-2Y US Treasury yield spread. The flattening or steepening of the US yield curve reflects the market's pricing of monetary policy's ease or tightness. Adjusting short-end rates and spreads to encourage or constrain credit expansion and leverage in the market is also a fundamental logic of monetary policy operations.
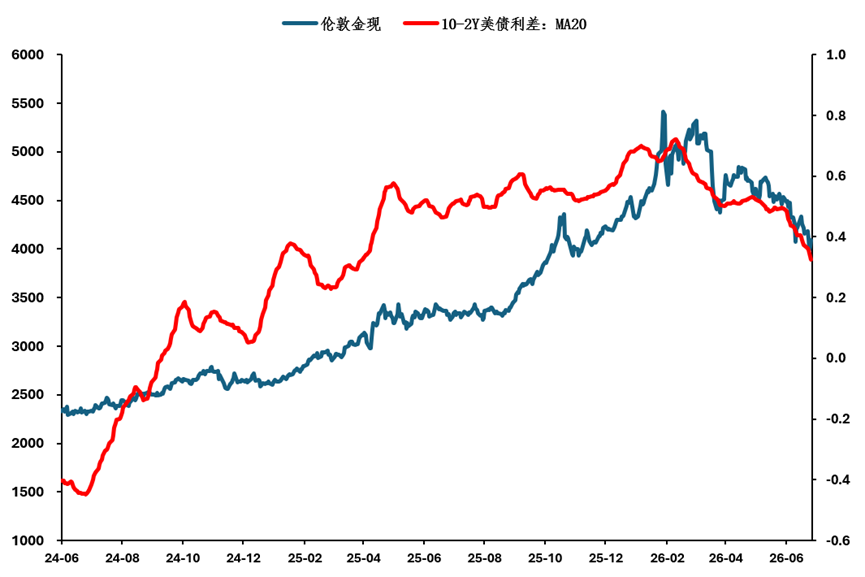
Looking back, since the beginning of this year—driven by factors such as improvements in US employment data, a more hawkish tone from Federal Reserve officials, and the change in the Federal Reserve Chair nominee from Milan to Walsh—the US Treasury yield curve shifted from steepening to flattening, which indeed marked a turning point in this round of precious metals performance.
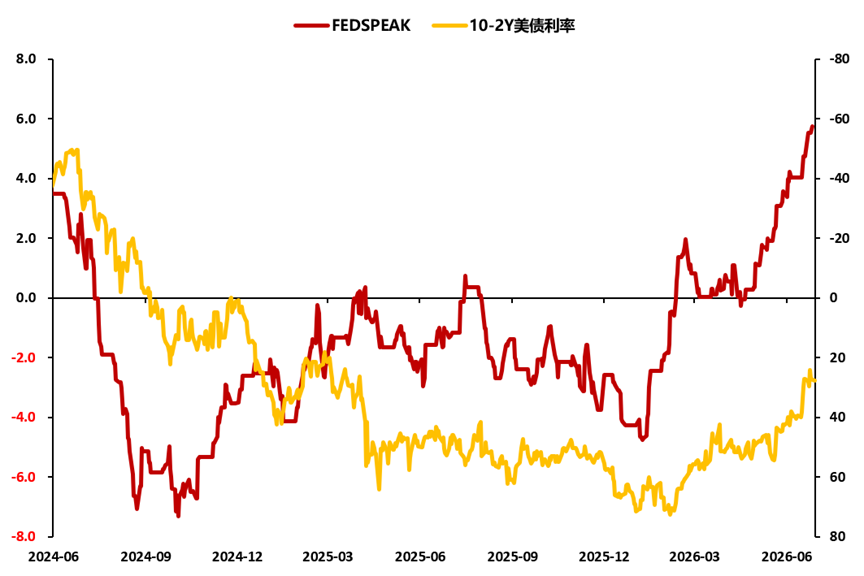
However, I also believe that considering only monetary policy is not enough to explain the further impact of liquidity on precious metals prices, especially the accelerated declines after Q2/the Iran conflict.Yet, when considering broader macro trading narratives, the explanatory power is significantly enhanced.
In my view, the two most important macro narratives in the second quarter are: first, the policy shift of the Federal Reserve and the stronger US dollar narrative; and second, the independent rally of the “hard” technology equity sector.
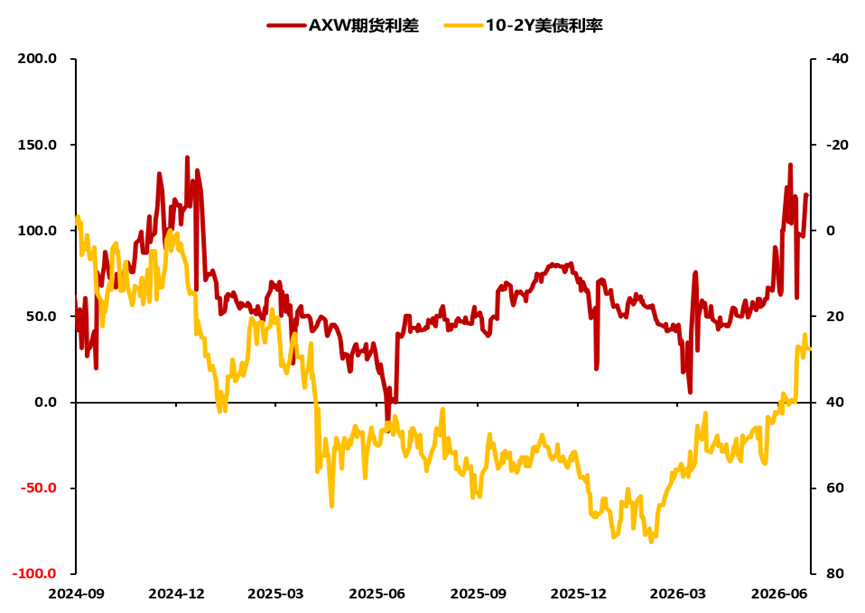
Some market peers may not have noticed that, behind the independent rally in the “hard” technology equity sector, leverage levels in major global markets have been climbing rapidly to historical highs.This means that overall liquidity, already converging, has been further siphoned off and squeezed by equity leverage, causing a general bleed in other macro asset classes apart from the “hard” technology equity sector.
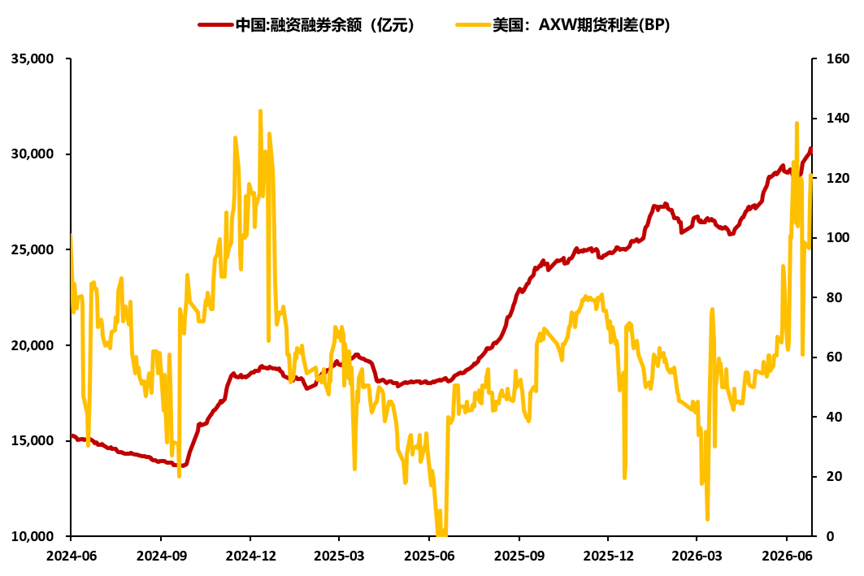
The financial attributes are the decisive factor for precious metals, especially for silver—which is more driven by speculative behavior—making liquidity squeeze a much more convincing explanation. Further, weighed down by a relatively weak fundamental backdrop, the quick correction in the Hang Seng Technology Index and other seasoned sectors under the “Davis Double Hit” can also be reasonably explained.
Will the liquidity squeeze pattern continue? In my view, the primary factor is the leverage siphoning effect from the independent rally in “hard” tech, with monetary policy as a secondary aspect. Currently, capital expenditure for AI is still in an accelerated expansion phase and is less sensitive to high interest rates. From a medium-term perspective, tech sector leverage likely has not yet peaked. Moreover, the wealth effect of strong equities may impose periodic inflationary pressures, restricting room for central bank easing.
Therefore, in my opinion, the "liquidity pain" for precious metals may well continue.
BFC Talks
Together with you in 2026
Welcome to leave a message in the background
to communicate with us
Disclaimer: The content of this article solely reflects the author's opinion and does not represent the platform in any capacity. This article is not intended to serve as a reference for making investment decisions.
You may also like

Wall Street giants collectively raise rate hike forecasts, US Treasury futures continue to fall, gold drops over 1% to break 4000
After the US October CPI exceeded expectations, Goldman Sachs and Nomura added a forecast for an interest rate hike in March next year, while Deutsche Bank included a forecast for a rate hike in January next year. Currently, the market has fully priced in a 25 basis point rate hike in December, with a 13% probability for a 50 basis point hike. On Wednesday, the US Treasury spot market was closed, but Treasury futures continued to fall, with corresponding yields rising by about 2 to 4 basis points, and spot gold came under pressure, dropping by 1.1%.

No Need to Worry About the Cooling Down of AI Data Center Construction? The US Import Boom Is Unlikely to Subside in the Short Term, Real Impact May Come in 2029
It takes an average of 4.8 years from finalizing investment to starting construction of a data center project, and an additional 2.6 years from construction start to becoming operational. Servers usually cannot be installed until after the building structure and racks are completed. For trade partners such as Taiwan (China), South Korea, and Mexico who rely on US data center supply chain demand, the inertia in construction timelines provides at least a one- to two-year buffer for future exports.

Federal Reserve Major Debate: When Should the Tenure of “Number Three” Williams End?
The main point of contention is whether Williams should step down in June 2028, upon completing a full 10-year term, or in June 2027, when he reaches the mandatory retirement age of 65. Analysts point out that the Federal Reserve Board holds ultimate discretion; if he leaves early, Fed Chair Waller would be able to assert greater control over the appointment to this critical position. However, forcing Williams to shorten his term could easily be interpreted as political manipulation. Williams himself is expected to serve until June 2028.

Crypto prices
More


