Bitget App
Trade smarter
Buy cryptoMarketsTradeFuturesStocksEarnInstitutionAI & More
Can MemeCore clear $1.28 resistance? THIS setup hints at…

Can MemeCore clear $1.28 resistance? THIS setup hints at…

AMBCryptoAMBCrypto2026/07/07 19:03
By:AMBCrypto

MemeCore’s native token M has extended its decline over the past 24 hours, losing roughly 11% even as the memecoin-focused blockchain retained a 111% gain over the past seven days.

On the surface, that pullback erases only about a tenth of M’s accumulated gains and reads as a routine corrective phase.

The underlying data tells a different story, with sellers gaining ground across the market in a way that could drag the asset lower from current levels.

@media only screen and (min-width: 0px) and (min-height: 0px) { div[id^="bsa-zone_1774359638628-7_123456"] { min-height: 50px; transition: min-height 0.3s ease; } } @media only screen and (min-width: 640px) and (min-height: 0px) { div[id^="bsa-zone_1774359638628-7_123456"] { min-height: 90px; } }
AD

Is selling pressure getting stronger?

Capital is contracting across MemeCore’s markets, with the gap between spot and perpetual traders narrowing as fresh flows move into the derivatives side.

Spot Netflow data showed buyers absorbed roughly $790,000 worth of M, while sellers offloaded about $743,000, leaving a slim net inflow of around $56,000.

That balance tilts toward buyers, yet the edge is too thin to spark a decisive rally, and the imbalance sharpens in the perpetual market, where rising inflows are colliding with heavy selling volume.
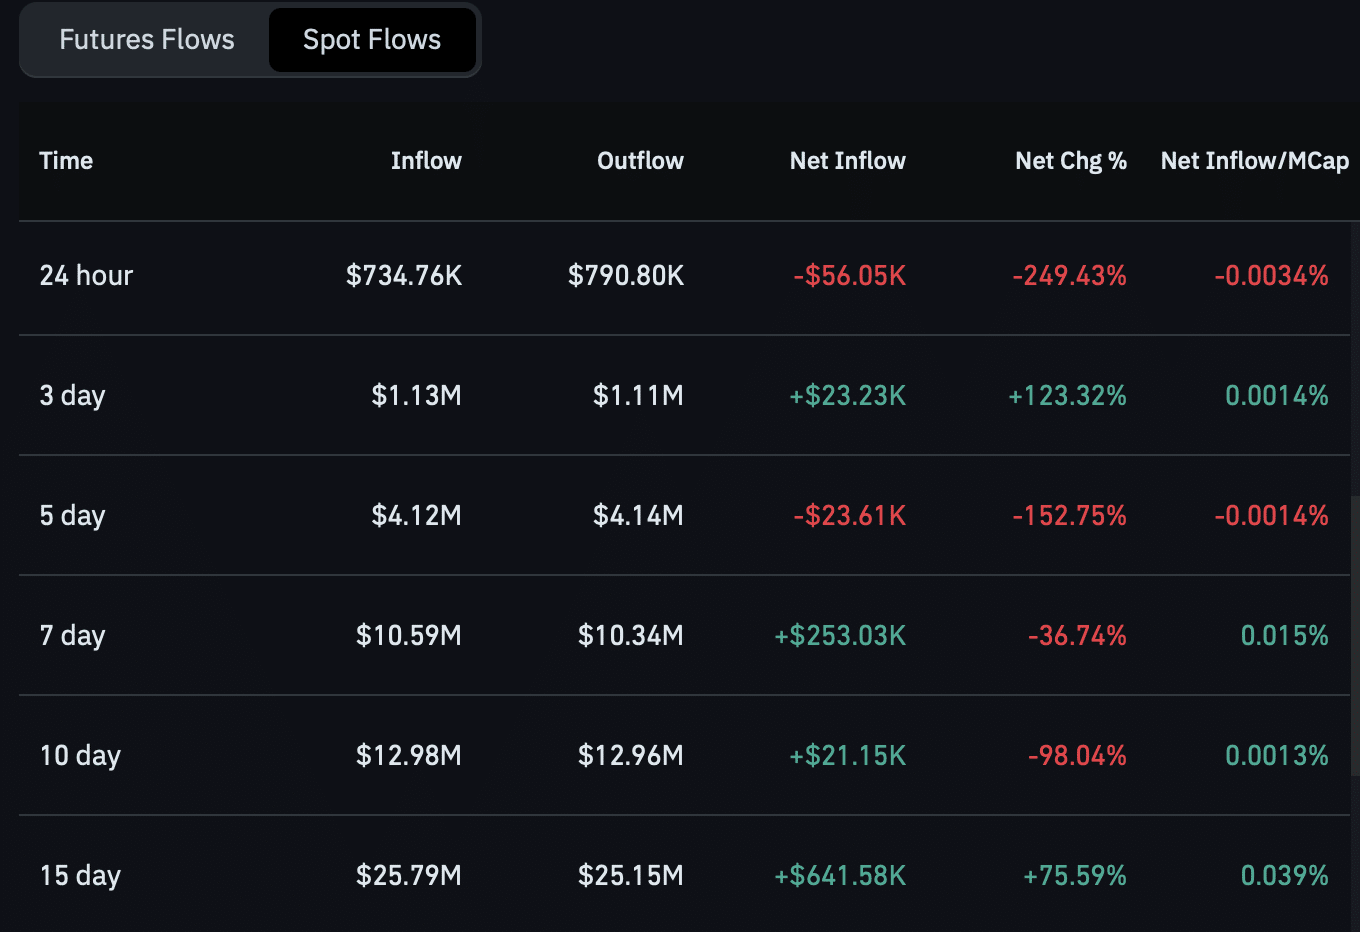
Can MemeCore clear $1.28 resistance? THIS setup hints at… image 0 Source: CoinGlass

MemeCore’s perpetual contracts drew a netflow of roughly $668,200, pointing to more capital channeled into leveraged positions on M. That inflow skews toward sellers, though, the Taker Buy Sell Ratio has slid to 0.823 in the latest CoinGlass reading, meaning market sells are outpacing market buys.

Mounting sell pressure in the perpetual market, set against shrinking spot capital, leaves M in a tight spot as it tries to rebuild momentum for a near-term move higher.

MemeCore [M] tests a major level

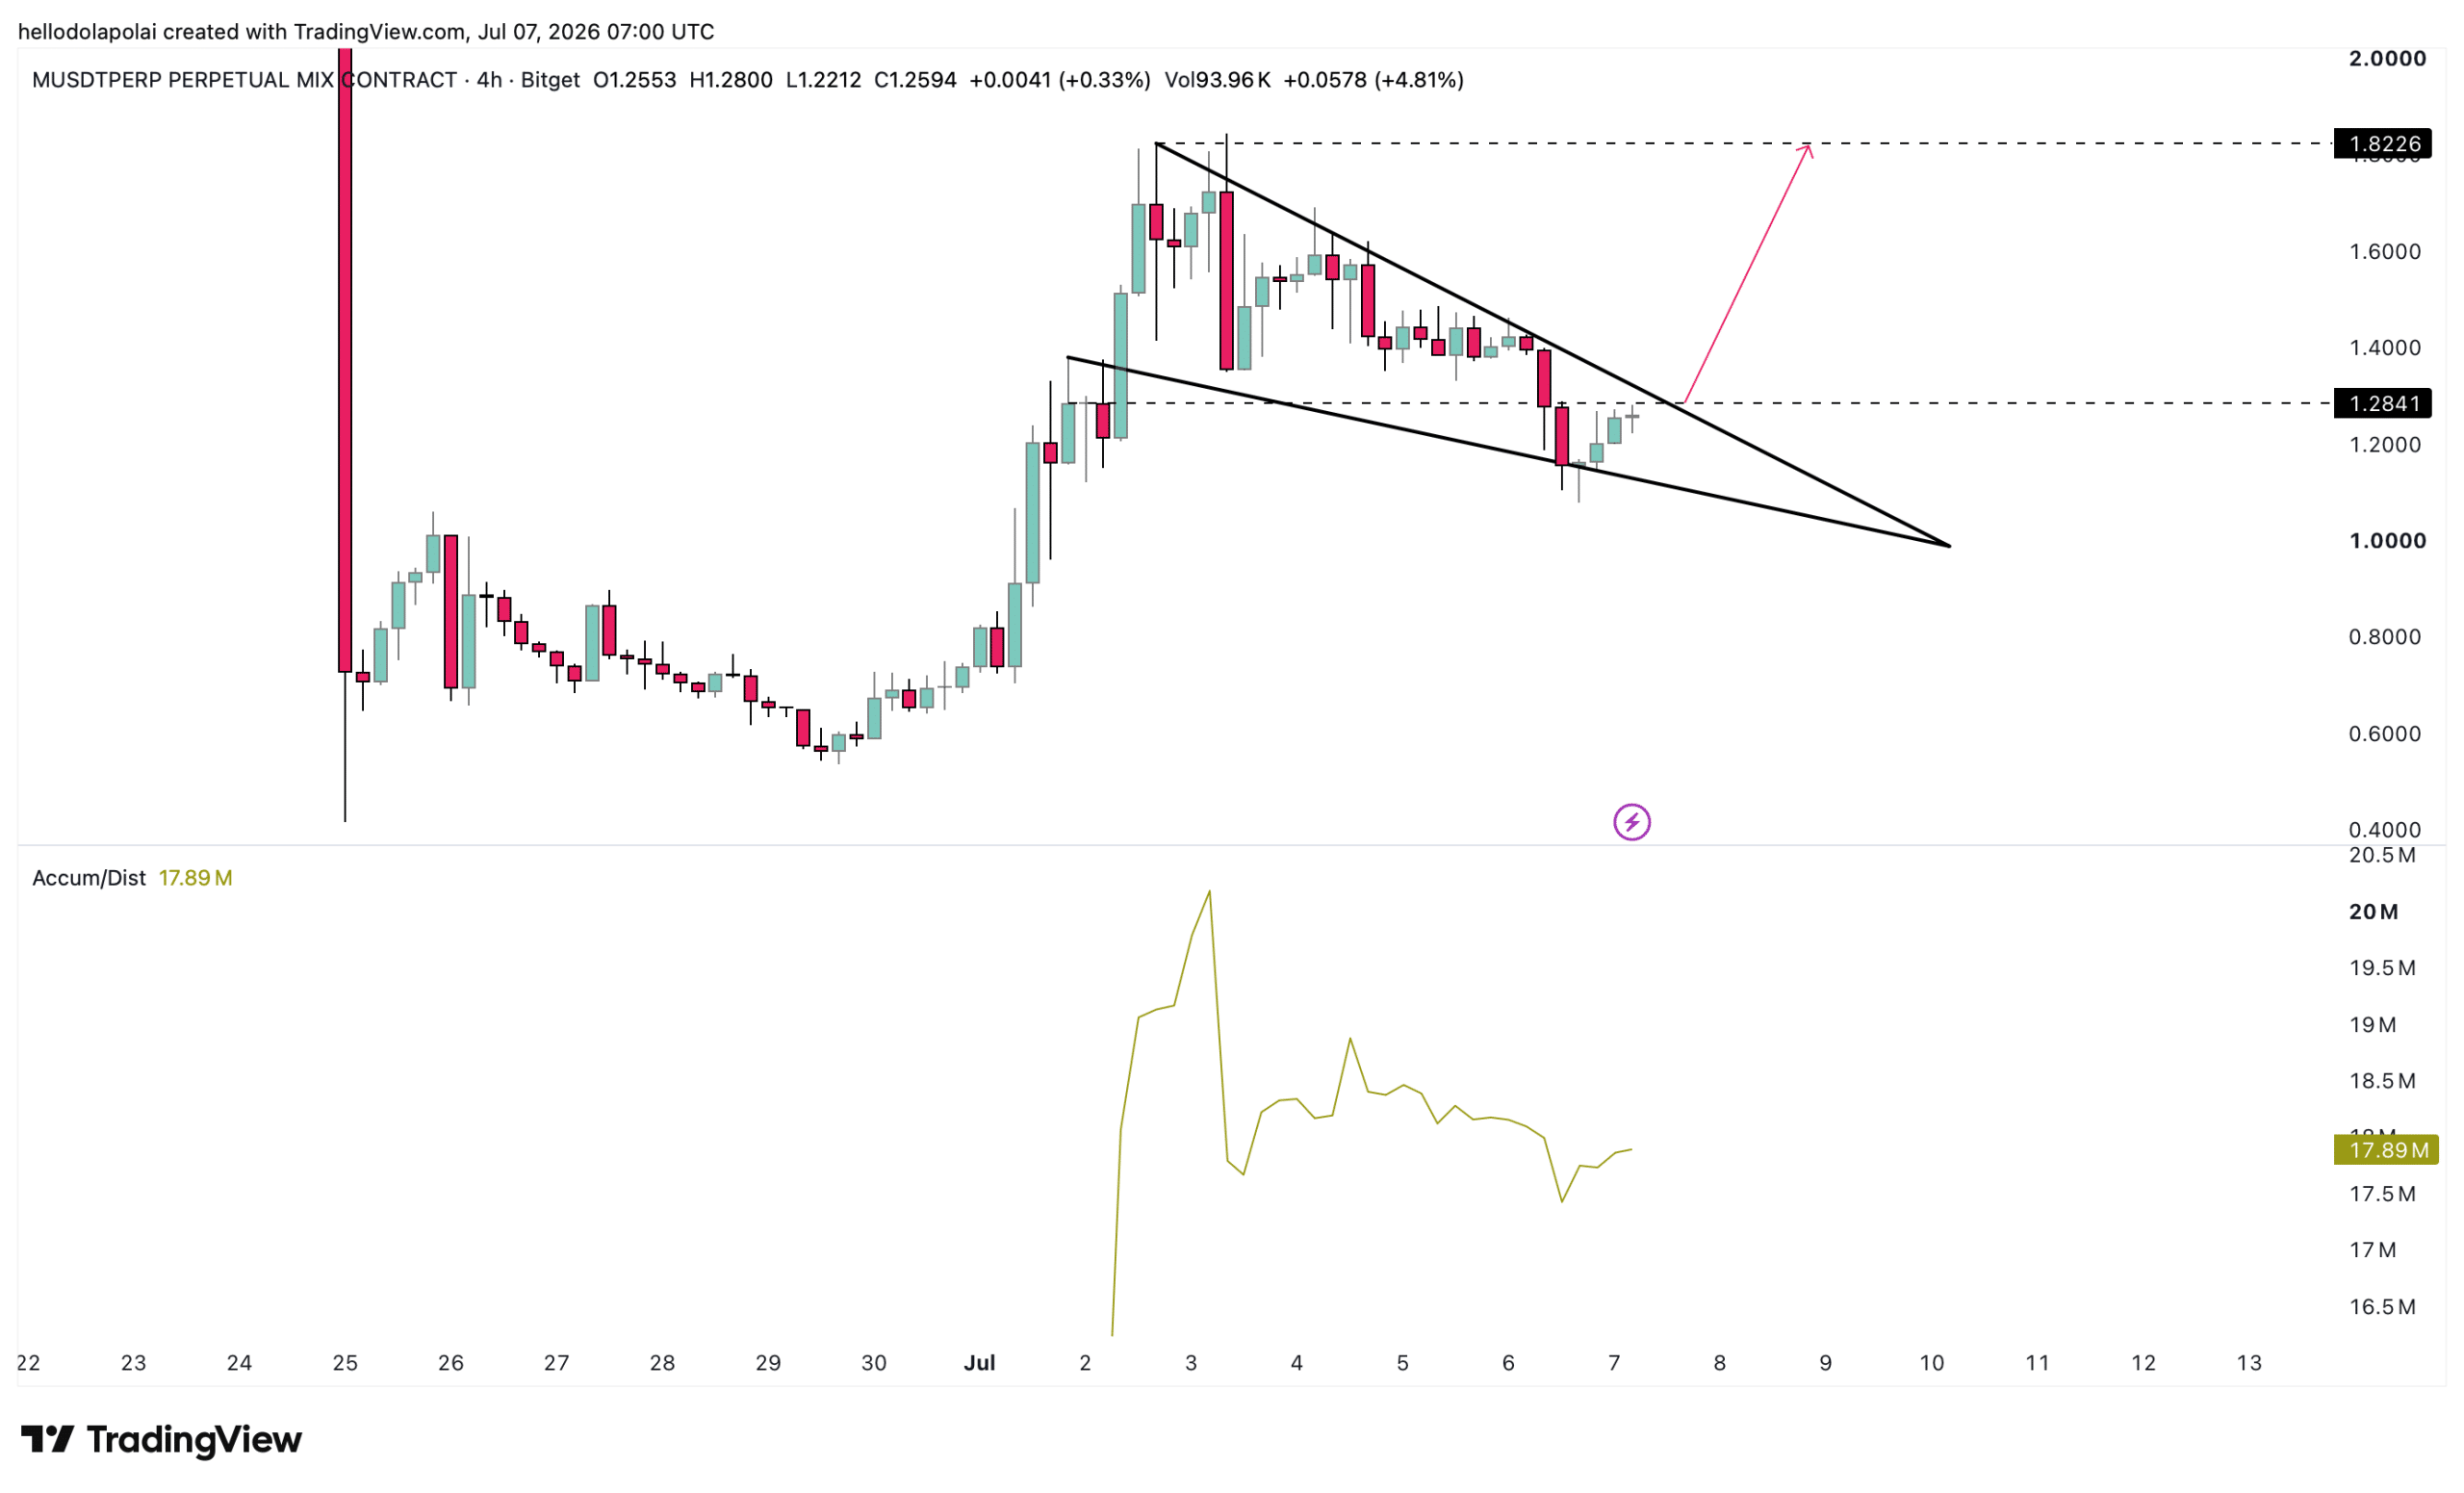
MemeCore traded inside a symmetrical triangle pattern.

The formation typically develops after a sharp price advance as the price consolidates between converging support and resistance lines. The pattern often precedes a breakout.

M now needed to clear horizontal resistance at $1.28.

A break above that level would still leave the price facing the pattern’s descending resistance. Clearing both barriers could confirm a stronger bullish move, while another rejection would likely extend consolidation.
Can MemeCore clear $1.28 resistance? THIS setup hints at… image 1 Source: TradingView

Reinforcing the setup, the Accumulation/Distribution (A/D) indicator is climbing, a sign that buying has outweighed selling across the broader market.

A sustained rise in the indicator would show accumulation building beneath the price, a dynamic that tends to support M over time.

Whales accumulate as retail steps back

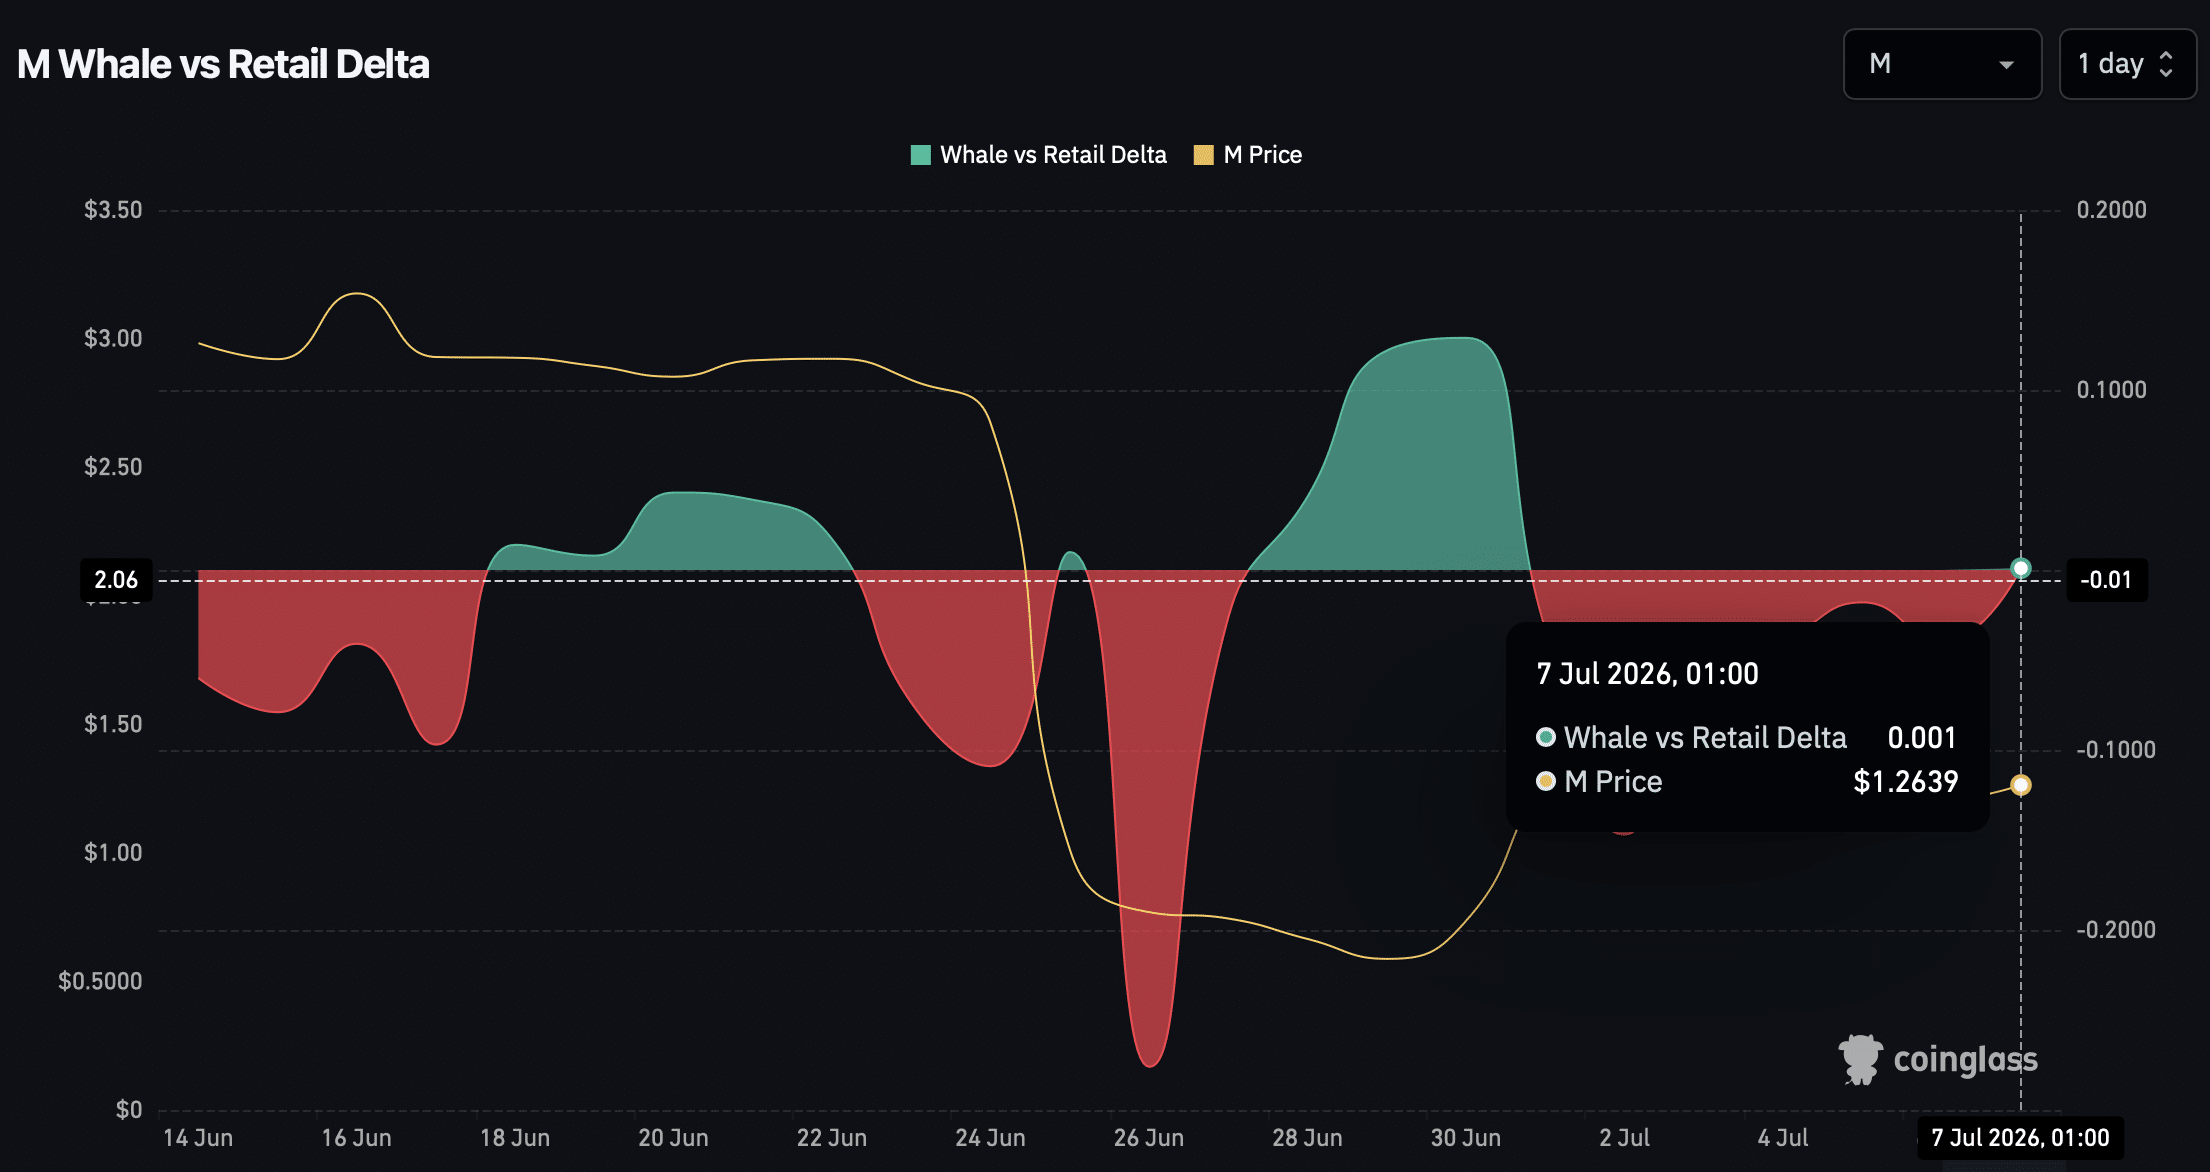
The Whale-to-Retail Delta recently flipped positive, though only marginally, at 0.01, a slim edge for large holders over retail participants.

That shift points to whales stepping in while retail investors are exiting.

Whales hold deep capital that frequently steers market direction, and their positioning could prove decisive in whether M resumes its slide or turns higher.
Can MemeCore clear $1.28 resistance? THIS setup hints at… image 2 Source: CoinGlass

Even so, Spot buying continued outweighing selling, while most bearish pressure originated from the perpetual market. The A/D indicator also continued pointing toward accumulation.

If whale accumulation continues supporting Spot demand, M could strengthen its rebound and build on the gains recorded over recent weeks.

Final Summary

  • MemeCore’s 11% decline coincided with growing selling pressure in perpetual markets despite positive Spot Netflow.
  • Whales accumulated while retail activity weakened, offering early signs of underlying confidence.


 

0
0

Disclaimer: The content of this article solely reflects the author's opinion and does not represent the platform in any capacity. This article is not intended to serve as a reference for making investment decisions.

Understand the market, then trade.
Bitget offers one-stop trading for cryptocurrencies, stocks, and gold.
Trade now!

You may also like

Wall Street giants collectively raise rate hike forecasts, US Treasury futures continue to fall, gold drops over 1% to break 4000

After the US October CPI exceeded expectations, Goldman Sachs and Nomura added a forecast for an interest rate hike in March next year, while Deutsche Bank included a forecast for a rate hike in January next year. Currently, the market has fully priced in a 25 basis point rate hike in December, with a 13% probability for a 50 basis point hike. On Wednesday, the US Treasury spot market was closed, but Treasury futures continued to fall, with corresponding yields rising by about 2 to 4 basis points, and spot gold came under pressure, dropping by 1.1%.

华尔街见闻•2026/11/11 21:18
Wall Street giants collectively raise rate hike forecasts, US Treasury futures continue to fall, gold drops over 1% to break 4000

No Need to Worry About the Cooling Down of AI Data Center Construction? The US Import Boom Is Unlikely to Subside in the Short Term, Real Impact May Come in 2029

It takes an average of 4.8 years from finalizing investment to starting construction of a data center project, and an additional 2.6 years from construction start to becoming operational. Servers usually cannot be installed until after the building structure and racks are completed. For trade partners such as Taiwan (China), South Korea, and Mexico who rely on US data center supply chain demand, the inertia in construction timelines provides at least a one- to two-year buffer for future exports.

华尔街见闻•2026/11/11 21:18
No Need to Worry About the Cooling Down of AI Data Center Construction? The US Import Boom Is Unlikely to Subside in the Short Term, Real Impact May Come in 2029

Federal Reserve Major Debate: When Should the Tenure of “Number Three” Williams End?

The main point of contention is whether Williams should step down in June 2028, upon completing a full 10-year term, or in June 2027, when he reaches the mandatory retirement age of 65. Analysts point out that the Federal Reserve Board holds ultimate discretion; if he leaves early, Fed Chair Waller would be able to assert greater control over the appointment to this critical position. However, forcing Williams to shorten his term could easily be interpreted as political manipulation. Williams himself is expected to serve until June 2028.

华尔街见闻•2026/11/11 21:18
Federal Reserve Major Debate: When Should the Tenure of “Number Three” Williams End?

