
Solana price prediction as tokenized assets drive network activity to record highs

Solana has extended its July rally after record on-chain activity, tokenized stock issuance, and steady ETF inflows revived bullish sentiment.
- Solana climbed above $81 after tokenized stock issuance and record network activity boosted buying interest.
- Technical charts show bulls defending $80 support while traders watch $83 and $90 as the next resistance levels.
- Analysts remain optimistic on long-term upside, though macro risks and liquidity could limit near-term gains.
According to data from crypto.news, Solana (SOL) extended its recovery this week, gaining roughly 11% over several sessions to trade around $81 after briefly reclaiming the $82 level. The rally accelerated as institutional adoption on the network continued to expand, led by Securitize tokenizing $295 million worth of New York Stock Exchange-listed common stock on Solana following its SPAC debut.
The development arrived alongside the launch of the Solana Foundation’s Governance Proposals framework, introducing formal on-chain validator voting and adding another utility milestone for the ecosystem.
Network activity has expanded at the same time. Solana processed more than one billion weekly non-vote transactions for the first time, while tokenized asset spot volume reached an all-time quarterly high of $5.77 billion, reinforcing the network’s growing role in real-world asset issuance.
Institutional demand also remained positive, with spot Solana ETFs recording approximately $5.75 million in net inflows even as several other crypto investment products experienced persistent capital outflows.
Technical structure has shifted back in favor of buyers
The daily chart shows Solana recovering from its June selloff after buyers defended the long-term support zone near $73, close to the 0.786 Fibonacci retracement level referenced by many traders during last month’s decline. Price has now reclaimed the previous breakdown area around $80.14 and is attempting to convert it into support while approaching horizontal resistance near $83.13.
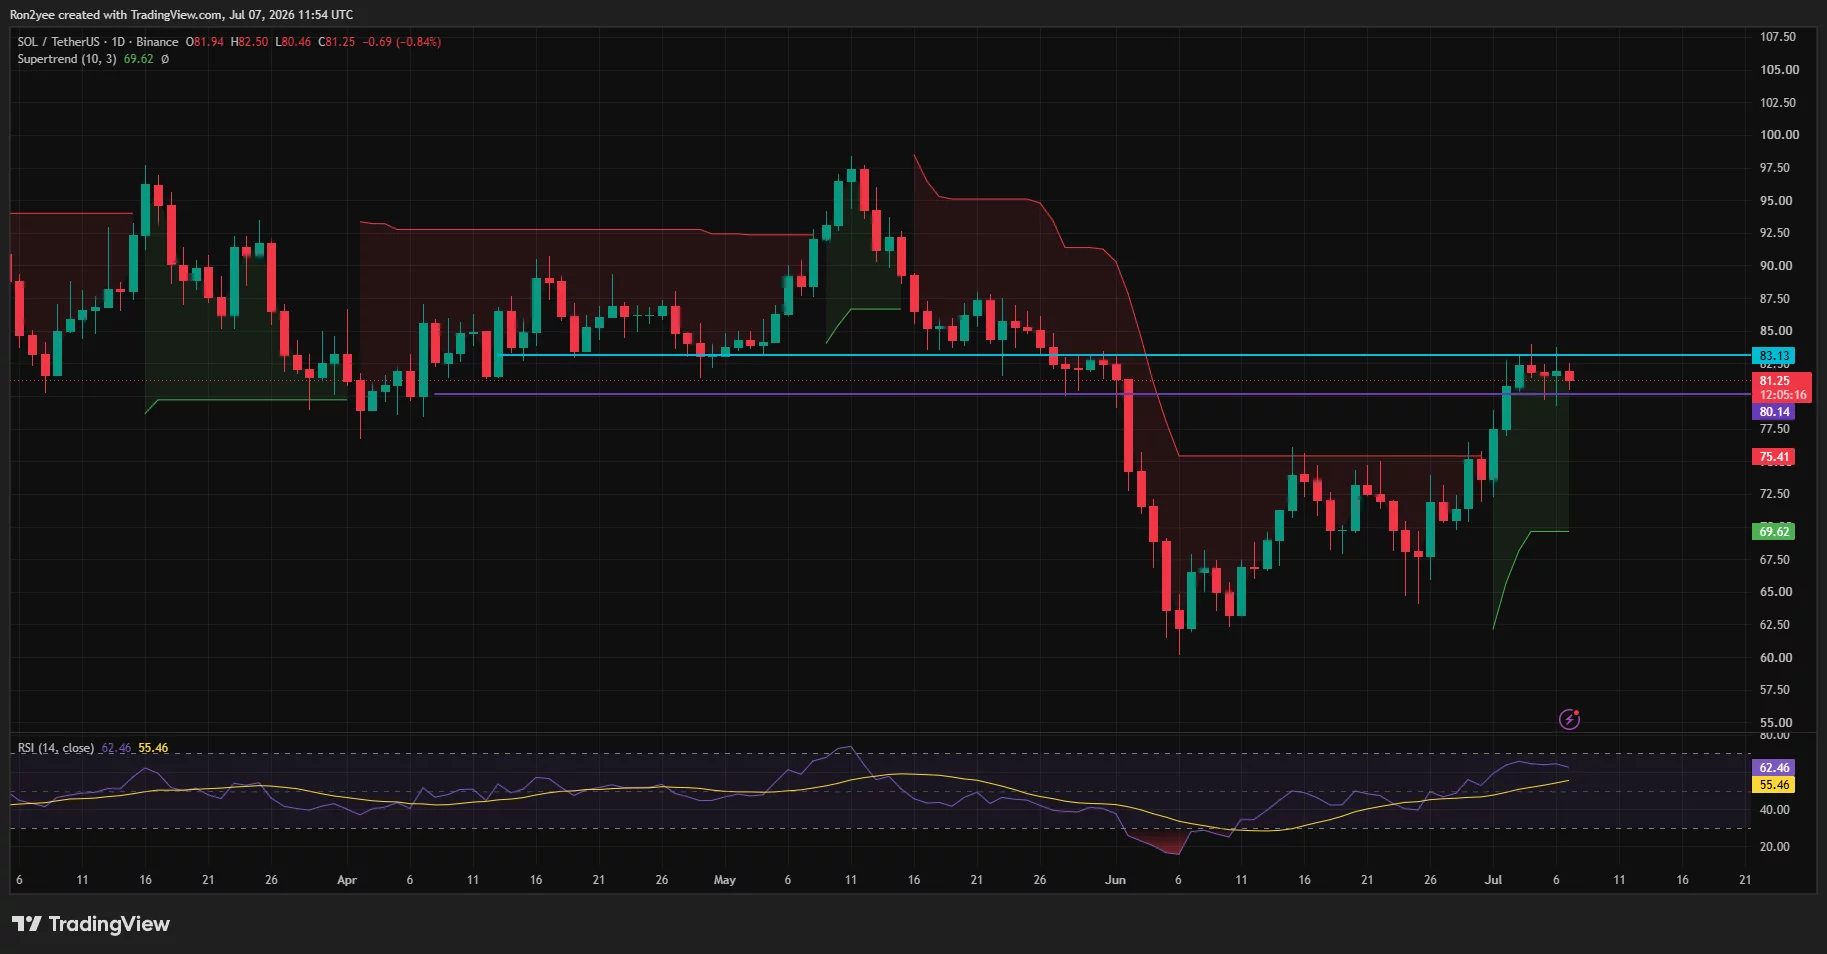 Solana daily price chart — July 7 | Source:
crypto.news
Momentum indicators have improved alongside the rebound. The daily RSI has climbed above 62 after recovering from oversold conditions in June, while the Supertrend indicator has remained bullish with dynamic support near $69.6. A successful close above $83 could expose the next resistance around $90, whereas failure to hold above $80 may invite another test of the $75.4 support region.
Shorter-term charts also favor bulls. On the 4-hour timeframe, SOL continues trading above its 20-, 50-, 100- and 200-period moving averages, with the 20 SMA near $81.4 providing immediate dynamic support. The moving average alignment remains constructive even as price has entered a brief consolidation after last week’s sharp advance. The Aroon indicator still favors buyers, although the slight decline in Aroon Up suggests momentum has slowed while the market waits for another catalyst.
 Solana 4-hour price chart — July 7 | Source:
crypto.news
Derivatives positioning presents a similar picture. CoinGlass liquidation heatmaps show one of the largest nearby short liquidation clusters sitting around the $84 level. A decisive move through that zone could trigger forced short covering and accelerate upside toward the upper liquidity pocket near $87. On the downside, dense long liquidation levels have accumulated between $78 and $79, making that area an important support if profit-taking intensifies.
 Solana liquidation heatmap | Source:
CoinGlass
Analysts target triple-digit prices while key resistance remains intact
Market participants have also become more optimistic after Solana strengthened against Bitcoin. Commenting on the latest structure, analyst Michaël van de Poppe wrote that SOL “is still in an uptrend here,” adding that it has broken its year-long downtrend versus Bitcoin.
“I don’t think that we’ll stall, I do think that we’ll continue to see strength happening here,” he wrote, adding that he would buy lower levels if a deeper correction develops before concluding that “it’s a matter of time until $SOL regains the $100+ levels.”
Despite the improving technical backdrop, Solana remains roughly 74% below its all-time high near $293 and more than 40% lower year to date. Macro uncertainty surrounding future Federal Reserve policy, geopolitical risks, and relatively thin crypto spot liquidity continues to limit aggressive positioning. Until bulls establish sustained closes above the $90 and $100 resistance zones, the current recovery is likely to remain vulnerable to renewed selling pressure despite the network’s strengthening institutional fundamentals.
Disclaimer: The content of this article solely reflects the author's opinion and does not represent the platform in any capacity. This article is not intended to serve as a reference for making investment decisions.
You may also like
Wall Street giants collectively raise rate hike forecasts, US Treasury futures continue to fall, gold drops over 1% to break 4000
After the US October CPI exceeded expectations, Goldman Sachs and Nomura added a forecast for an interest rate hike in March next year, while Deutsche Bank included a forecast for a rate hike in January next year. Currently, the market has fully priced in a 25 basis point rate hike in December, with a 13% probability for a 50 basis point hike. On Wednesday, the US Treasury spot market was closed, but Treasury futures continued to fall, with corresponding yields rising by about 2 to 4 basis points, and spot gold came under pressure, dropping by 1.1%.

No Need to Worry About the Cooling Down of AI Data Center Construction? The US Import Boom Is Unlikely to Subside in the Short Term, Real Impact May Come in 2029
It takes an average of 4.8 years from finalizing investment to starting construction of a data center project, and an additional 2.6 years from construction start to becoming operational. Servers usually cannot be installed until after the building structure and racks are completed. For trade partners such as Taiwan (China), South Korea, and Mexico who rely on US data center supply chain demand, the inertia in construction timelines provides at least a one- to two-year buffer for future exports.

Federal Reserve Major Debate: When Should the Tenure of “Number Three” Williams End?
The main point of contention is whether Williams should step down in June 2028, upon completing a full 10-year term, or in June 2027, when he reaches the mandatory retirement age of 65. Analysts point out that the Federal Reserve Board holds ultimate discretion; if he leaves early, Fed Chair Waller would be able to assert greater control over the appointment to this critical position. However, forcing Williams to shorten his term could easily be interpreted as political manipulation. Williams himself is expected to serve until June 2028.

Crypto prices
More


