Bitget App
Trade smarter
Buy cryptoMarketsTradeFuturesStocksEarnInstitutionAI & More
Solana Price Prediction: Can SOL Hold the 100-Day EMA After Its Busiest Week on Record?

Solana Price Prediction: Can SOL Hold the 100-Day EMA After Its Busiest Week on Record?

CoineditionCoinedition2026/07/07 08:09
By:Coinedition

Solana trades at $81.49 on July 7, down 0.49%, pressing directly against the 100-day EMA as the network posts its busiest week on record.
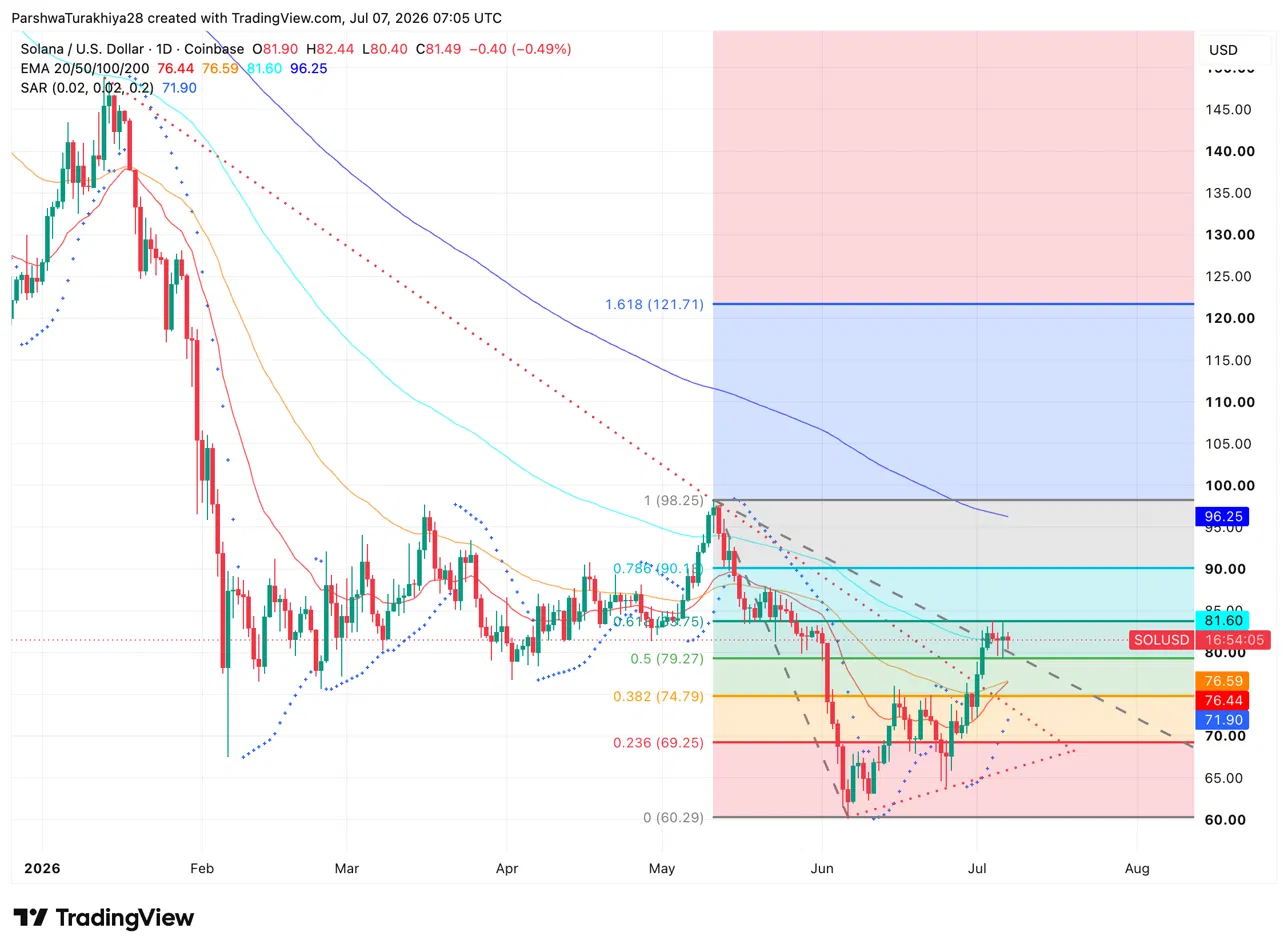
Solana Price Prediction: Can SOL Hold the 100-Day EMA After Its Busiest Week on Record? image 0 SOL 1D Price Action (Source: TradingView)

The daily chart shows SOL sitting right at the 100-day EMA at $81.60, a level that hasn’t been tested from below since the June breakdown. Price bounced off the $60.29 low and has worked through several Fibonacci retracement levels, clearing the 0.5 level at $79.27 and now pressing against the 0.618 at $83.75 as the next hurdle. The Parabolic SAR at $71.90 sits well below price, confirming the short-term recovery trend remains intact.

The 20-day and 50-day EMAs at $76.44 and $76.59 are now both below spot, having been reclaimed during the July recovery, which is the first time SOL has traded above both simultaneously since May. The 200-day EMA at $96.25 and the 0.786 Fibonacci level at $90.18 mark the heavier resistance zones above.

What Are The Key Support And Resistance Levels For SOL Today?

  • Support at $79.27 on the 0.5 Fib and $76.44 on the 20-day EMA
  • Resistance at $83.75 on the 0.618 Fib, then $90.18 on the 0.786 Fib
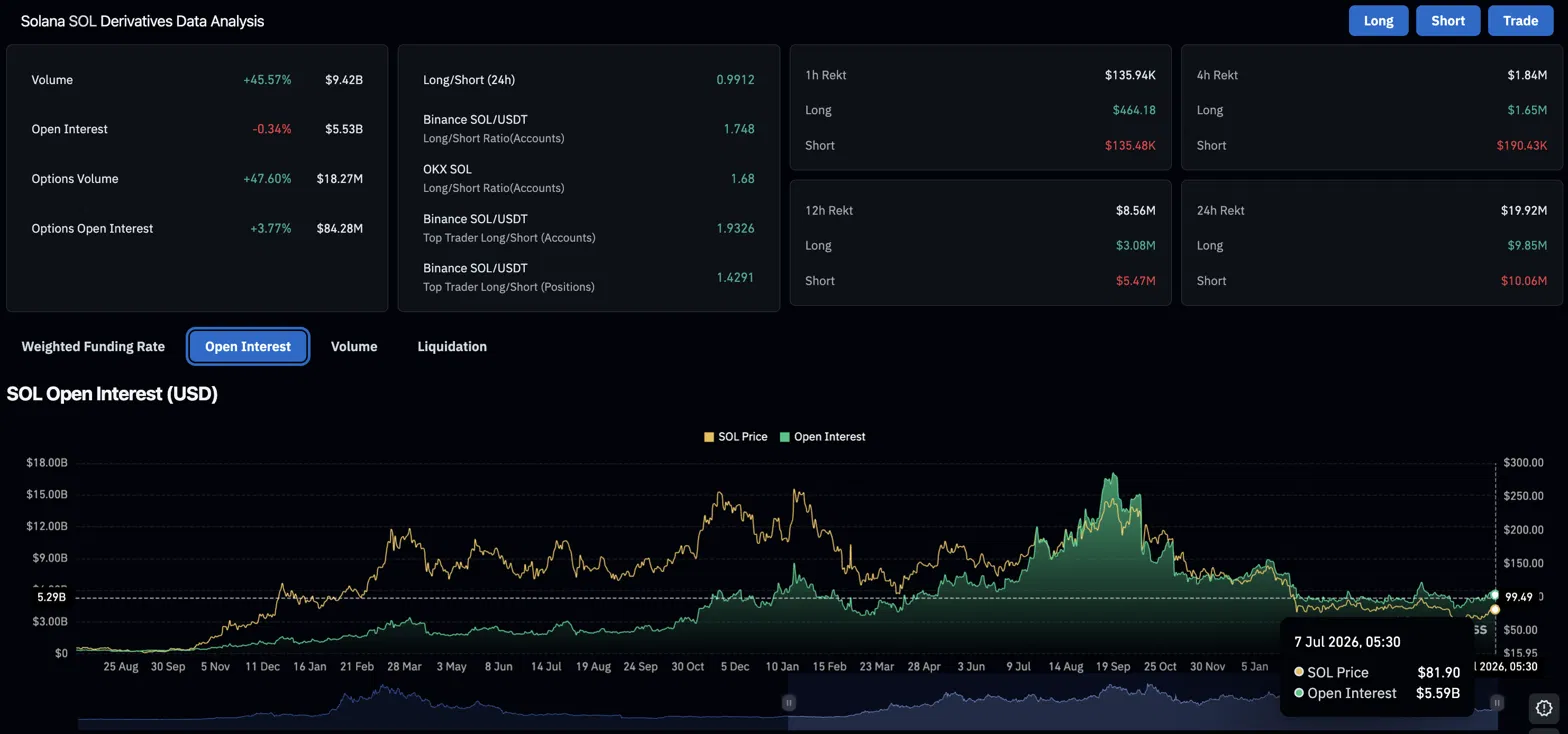
Solana Price Prediction: Can SOL Hold the 100-Day EMA After Its Busiest Week on Record? image 1 SOL Derivative Analysis (Source: Coinglass)

Volume jumped 45.57% to $9.42B while open interest barely moved, slipping 0.34% to $5.53B. That gap between volume and OI tells you traders are actively repositioning rather than stacking up new leveraged bets. Options volume also spiked 47.60% to $18.27M, meaning a growing number of participants are using options to hedge or take directional views rather than going straight through perpetuals.

The liquidation picture over the past 24 hours is about as balanced as it gets. Shorts lost $10.06M, longs lost $9.85M. Neither side took a real beating, which is actually unusual. It tells you the market is genuinely split on where SOL goes next from the $81 level, and no clear conviction trade has emerged yet.

🚨BREAKING: @Solana's weekly transaction activity hit a new all-time high, with 1B+ non-vote transactions processed last week. pic.twitter.com/x3GBDFHO6Q

— SolanaFloor (@SolanaFloor) July 6, 2026

Solana processed over one billion non-vote transactions in a single week for the first time, according to SolanaFloor. Non-vote transactions are the ones that actually matter for measuring real usage, covering activity from users, applications and traders rather than the background validator voting process. A spike of this size at the start of July points to a sharp pickup in ecosystem activity rather than a gradual trend.

📈DATA: In just two weeks, @Solana's weekly active users surged from 16.8 million to 29.7 million, an increase of 12.9 million wallets (+76.8%). pic.twitter.com/bbHWaJfitL

— SolanaFloor (@SolanaFloor) July 6, 2026

Weekly active users also surged from 16.8 million to 29.7 million in just two weeks, a jump of 12.9 million wallets, or 76.8%, pointing to a sharp acceleration in new participants entering the ecosystem rather than just existing users trading more.

@Solana ranks No. 2 in global spot crypto trading volume for the second straight week. $12.25B posted. pic.twitter.com/YsTfIqGm9n

— Solana Hub (@SolanaHub_) July 6, 2026

The network also ranked second in global spot crypto trading volume for the second consecutive week, processing $12.25 billion across centralized and decentralized exchanges combined. That figure held above Bybit’s $10.57 billion, with only Binance ahead. Two straight weeks at number two in global volume, combined with a weekly transaction record, positions Solana’s usage narrative well ahead of its price recovery.

July is one of SOL’s better months on the calendar. The average return sits at 24.6% and the median at 17.3%, with five of the past six Julys closing green. 

The 2025 reading came in at 11.3%, 2024 added 17.3%, and 2022 surged 26.3%. The 2026 reading is already tracking at 9.93% early in the month, running slightly below the median pace but with most of July still ahead.

  • Upside case: SOL holds above the 100-day EMA at $81.60, the transaction record drives continued ecosystem attention, and price targets the 0.786 Fib at $90.18 as the next recovery milestone.
  • Downside case: The 100-day EMA rejects price, SOL slips back below the 0.5 Fib at $79.27, and the 20-day EMA cluster near $76.44-$76.59 becomes the next support test.

div#ce-iframe-ads div#frame { margin: auto; text-align: center; }
0
0

Disclaimer: The content of this article solely reflects the author's opinion and does not represent the platform in any capacity. This article is not intended to serve as a reference for making investment decisions.

Understand the market, then trade.
Bitget offers one-stop trading for cryptocurrencies, stocks, and gold.
Trade now!

You may also like

Wall Street giants collectively raise rate hike forecasts, US Treasury futures continue to fall, gold drops over 1% to break 4000

After the US October CPI exceeded expectations, Goldman Sachs and Nomura added a forecast for an interest rate hike in March next year, while Deutsche Bank included a forecast for a rate hike in January next year. Currently, the market has fully priced in a 25 basis point rate hike in December, with a 13% probability for a 50 basis point hike. On Wednesday, the US Treasury spot market was closed, but Treasury futures continued to fall, with corresponding yields rising by about 2 to 4 basis points, and spot gold came under pressure, dropping by 1.1%.

华尔街见闻•2026/11/11 21:18
Wall Street giants collectively raise rate hike forecasts, US Treasury futures continue to fall, gold drops over 1% to break 4000

No Need to Worry About the Cooling Down of AI Data Center Construction? The US Import Boom Is Unlikely to Subside in the Short Term, Real Impact May Come in 2029

It takes an average of 4.8 years from finalizing investment to starting construction of a data center project, and an additional 2.6 years from construction start to becoming operational. Servers usually cannot be installed until after the building structure and racks are completed. For trade partners such as Taiwan (China), South Korea, and Mexico who rely on US data center supply chain demand, the inertia in construction timelines provides at least a one- to two-year buffer for future exports.

华尔街见闻•2026/11/11 21:18
No Need to Worry About the Cooling Down of AI Data Center Construction? The US Import Boom Is Unlikely to Subside in the Short Term, Real Impact May Come in 2029

Federal Reserve Major Debate: When Should the Tenure of “Number Three” Williams End?

The main point of contention is whether Williams should step down in June 2028, upon completing a full 10-year term, or in June 2027, when he reaches the mandatory retirement age of 65. Analysts point out that the Federal Reserve Board holds ultimate discretion; if he leaves early, Fed Chair Waller would be able to assert greater control over the appointment to this critical position. However, forcing Williams to shorten his term could easily be interpreted as political manipulation. Williams himself is expected to serve until June 2028.

华尔街见闻•2026/11/11 21:18
Federal Reserve Major Debate: When Should the Tenure of “Number Three” Williams End?


