
Bitget App
Trade smarter
Buy cryptoMarketsTradeFuturesStocksEarnInstitutionAI & More
Is XRP’s $1 price zone a bear trap? Here’s what the data suggests

Is XRP’s $1 price zone a bear trap? Here’s what the data suggests

CryptoNewsNetCryptoNewsNet2026/07/05 22:06
By:CryptoNewsNet
Back to the list

Is XRP’s $1 price zone a bear trap? Here’s what the data suggests

Is XRP’s $1 price zone a bear trap? Here’s what the data suggests image 0  ambcrypto.com 21 m
Is XRP’s $1 price zone a bear trap? Here’s what the data suggests image 1

Talk of a new altcoin cycle is starting to pick up again.

Based on how this week has played out, that narrative is beginning to gain traction. On the weekly timeframe, while Bitcoin [$BTC] is up more than 5%, Ethereum [$ETH] has attracted 2x the capital inflows, pushing the $ETH/$BTC ratio up nearly 7%. More importantly, this marks the ratio’s strongest weekly gain since August 2025, reinforcing the idea that “altcoin-led” momentum is starting to build across the market.

Ripple hasn’t been left behind. As the chart below shows, the token is up nearly 9% this week, with its highest wick reaching $1.18, a level it hadn’t reclaimed since losing it in mid-June. That move points to strong buying interest as capital continues rotating into higher-beta altcoins.
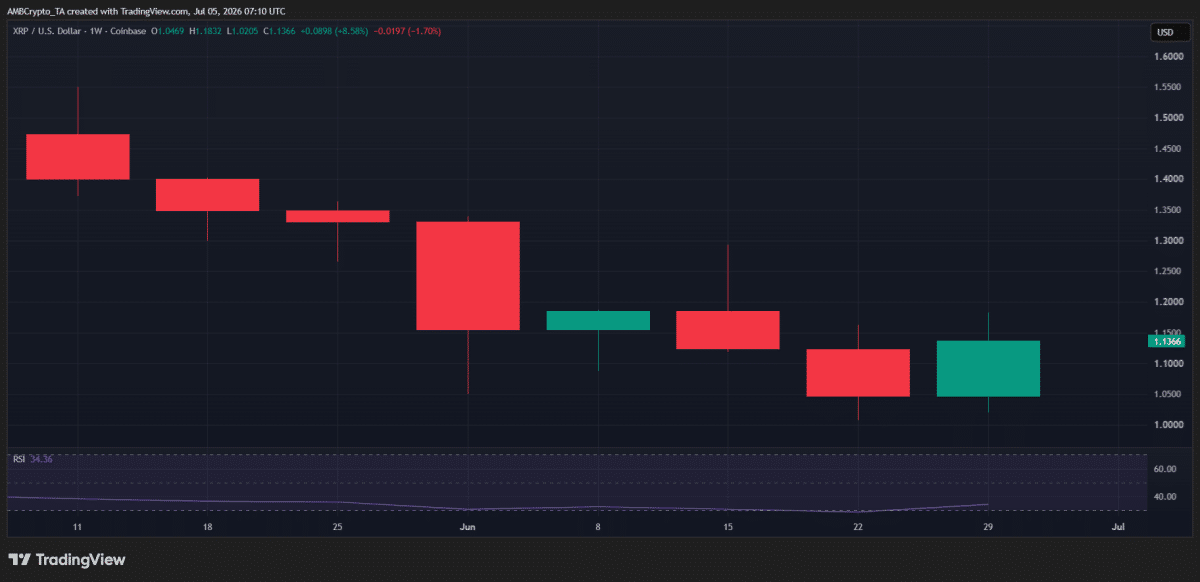
Is XRP’s $1 price zone a bear trap? Here’s what the data suggests image 2 Source: TradingView ( $XRP/ $USDT)

Backing this up, the $XRP/$USDT ratio has also climbed more than 3% this week.

Against this backdrop, leaning long on $XRP isn’t a stretch. In fact, an analyst recently flagged a whale opening a $16 million $XRP long at an average entry of $1.10. At the time of writing, the position was already sitting on roughly $477,000 in unrealized profit.

With altcoin momentum continuing to build, this doesn’t look like a random high-leverage bet. If anything, it signals growing conviction that $XRP still has room to move higher as capital continues rotating into altcoins. That naturally raises the question: Is $XRP’s current setup quietly turning into a textbook bear trap?

$XRP’s leverage spike puts the $1 level under the spotlight

Long positioning in $XRP is starting to go parabolic.

Normally, when leverage gets this crowded on the long side, the risk of a volatility event increases. Even a modest shift in sentiment can trigger a wave of long liquidations, especially with $XRP still trading around the $1 supply zone. In that scenario, the ongoing altcoin rally alone may not be enough to keep the uptrend intact.

That’s why the case for a near-term pullback is gaining traction, with liquidity continuing to stack up around the $1 level. But institutional positioning paints a different picture, suggesting $XRP’s latest move isn’t just riding the broader market’s altcoin momentum.
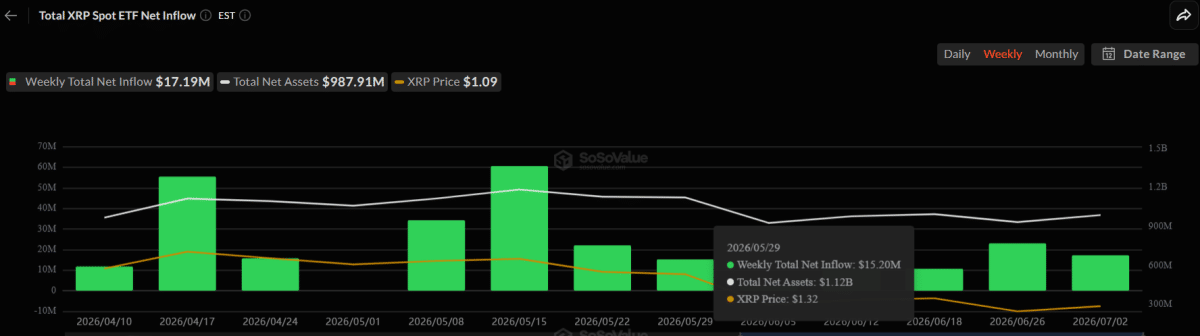
Is XRP’s $1 price zone a bear trap? Here’s what the data suggests image 3 Source: SoSoValue

As the chart above shows, it’s been another strong week for spot $XRP ETFs.

According to SoSoValue, U.S. spot Ripple ETFs recorded $17.19 million in inflows over the period. This came despite two days of net outflows during the week, showing demand remained resilient. More notably, the ETFs have now logged nine consecutive weeks of net inflows, pointing to “sustained” institutional interest.

By contrast, Ethereum ETFs have posted consecutive net outflows over the same period. This divergence could set $XRP apart from other altcoins. In simple terms, while $ETH is leading short-term gains, it still looks driven by capital rotation.

$XRP, on the other hand, is showing stronger longer-term momentum, making its consolidation around $1 look more like a potential bear trap, with long positioning adding to the bullish pressure.

Final Summary

  • Altcoins are gaining momentum, with $ETH and $XRP both seeing strong weekly inflows and price gains.
  • Even with heavy long leverage near $1, steady $XRP ETF inflows suggest demand is still strong and a bear trap is possible.
0
0

Disclaimer: The content of this article solely reflects the author's opinion and does not represent the platform in any capacity. This article is not intended to serve as a reference for making investment decisions.

Understand the market, then trade.
Bitget offers one-stop trading for cryptocurrencies, stocks, and gold.
Trade now!

You may also like

Wall Street giants collectively raise rate hike forecasts, US Treasury futures continue to fall, gold drops over 1% to break 4000

After the US October CPI exceeded expectations, Goldman Sachs and Nomura added a forecast for an interest rate hike in March next year, while Deutsche Bank included a forecast for a rate hike in January next year. Currently, the market has fully priced in a 25 basis point rate hike in December, with a 13% probability for a 50 basis point hike. On Wednesday, the US Treasury spot market was closed, but Treasury futures continued to fall, with corresponding yields rising by about 2 to 4 basis points, and spot gold came under pressure, dropping by 1.1%.

华尔街见闻•2026/11/11 21:18
Wall Street giants collectively raise rate hike forecasts, US Treasury futures continue to fall, gold drops over 1% to break 4000

No Need to Worry About the Cooling Down of AI Data Center Construction? The US Import Boom Is Unlikely to Subside in the Short Term, Real Impact May Come in 2029

It takes an average of 4.8 years from finalizing investment to starting construction of a data center project, and an additional 2.6 years from construction start to becoming operational. Servers usually cannot be installed until after the building structure and racks are completed. For trade partners such as Taiwan (China), South Korea, and Mexico who rely on US data center supply chain demand, the inertia in construction timelines provides at least a one- to two-year buffer for future exports.

华尔街见闻•2026/11/11 21:18
No Need to Worry About the Cooling Down of AI Data Center Construction? The US Import Boom Is Unlikely to Subside in the Short Term, Real Impact May Come in 2029

Federal Reserve Major Debate: When Should the Tenure of “Number Three” Williams End?

The main point of contention is whether Williams should step down in June 2028, upon completing a full 10-year term, or in June 2027, when he reaches the mandatory retirement age of 65. Analysts point out that the Federal Reserve Board holds ultimate discretion; if he leaves early, Fed Chair Waller would be able to assert greater control over the appointment to this critical position. However, forcing Williams to shorten his term could easily be interpreted as political manipulation. Williams himself is expected to serve until June 2028.

华尔街见闻•2026/11/11 21:18
Federal Reserve Major Debate: When Should the Tenure of “Number Three” Williams End?