
Ripple Price Analysis: What Are XRP’s Next Targets After 8% Weekly Surge?

Ripple’s XRP has delivered a strong recovery from its recent lows, validating the bullish divergence that developed near support. While the broader market structure remains corrective, the latest rally has pushed the price back toward a critical technical inflection point where the next directional move could be determined.
Ripple Price Analysis: The Daily Chart
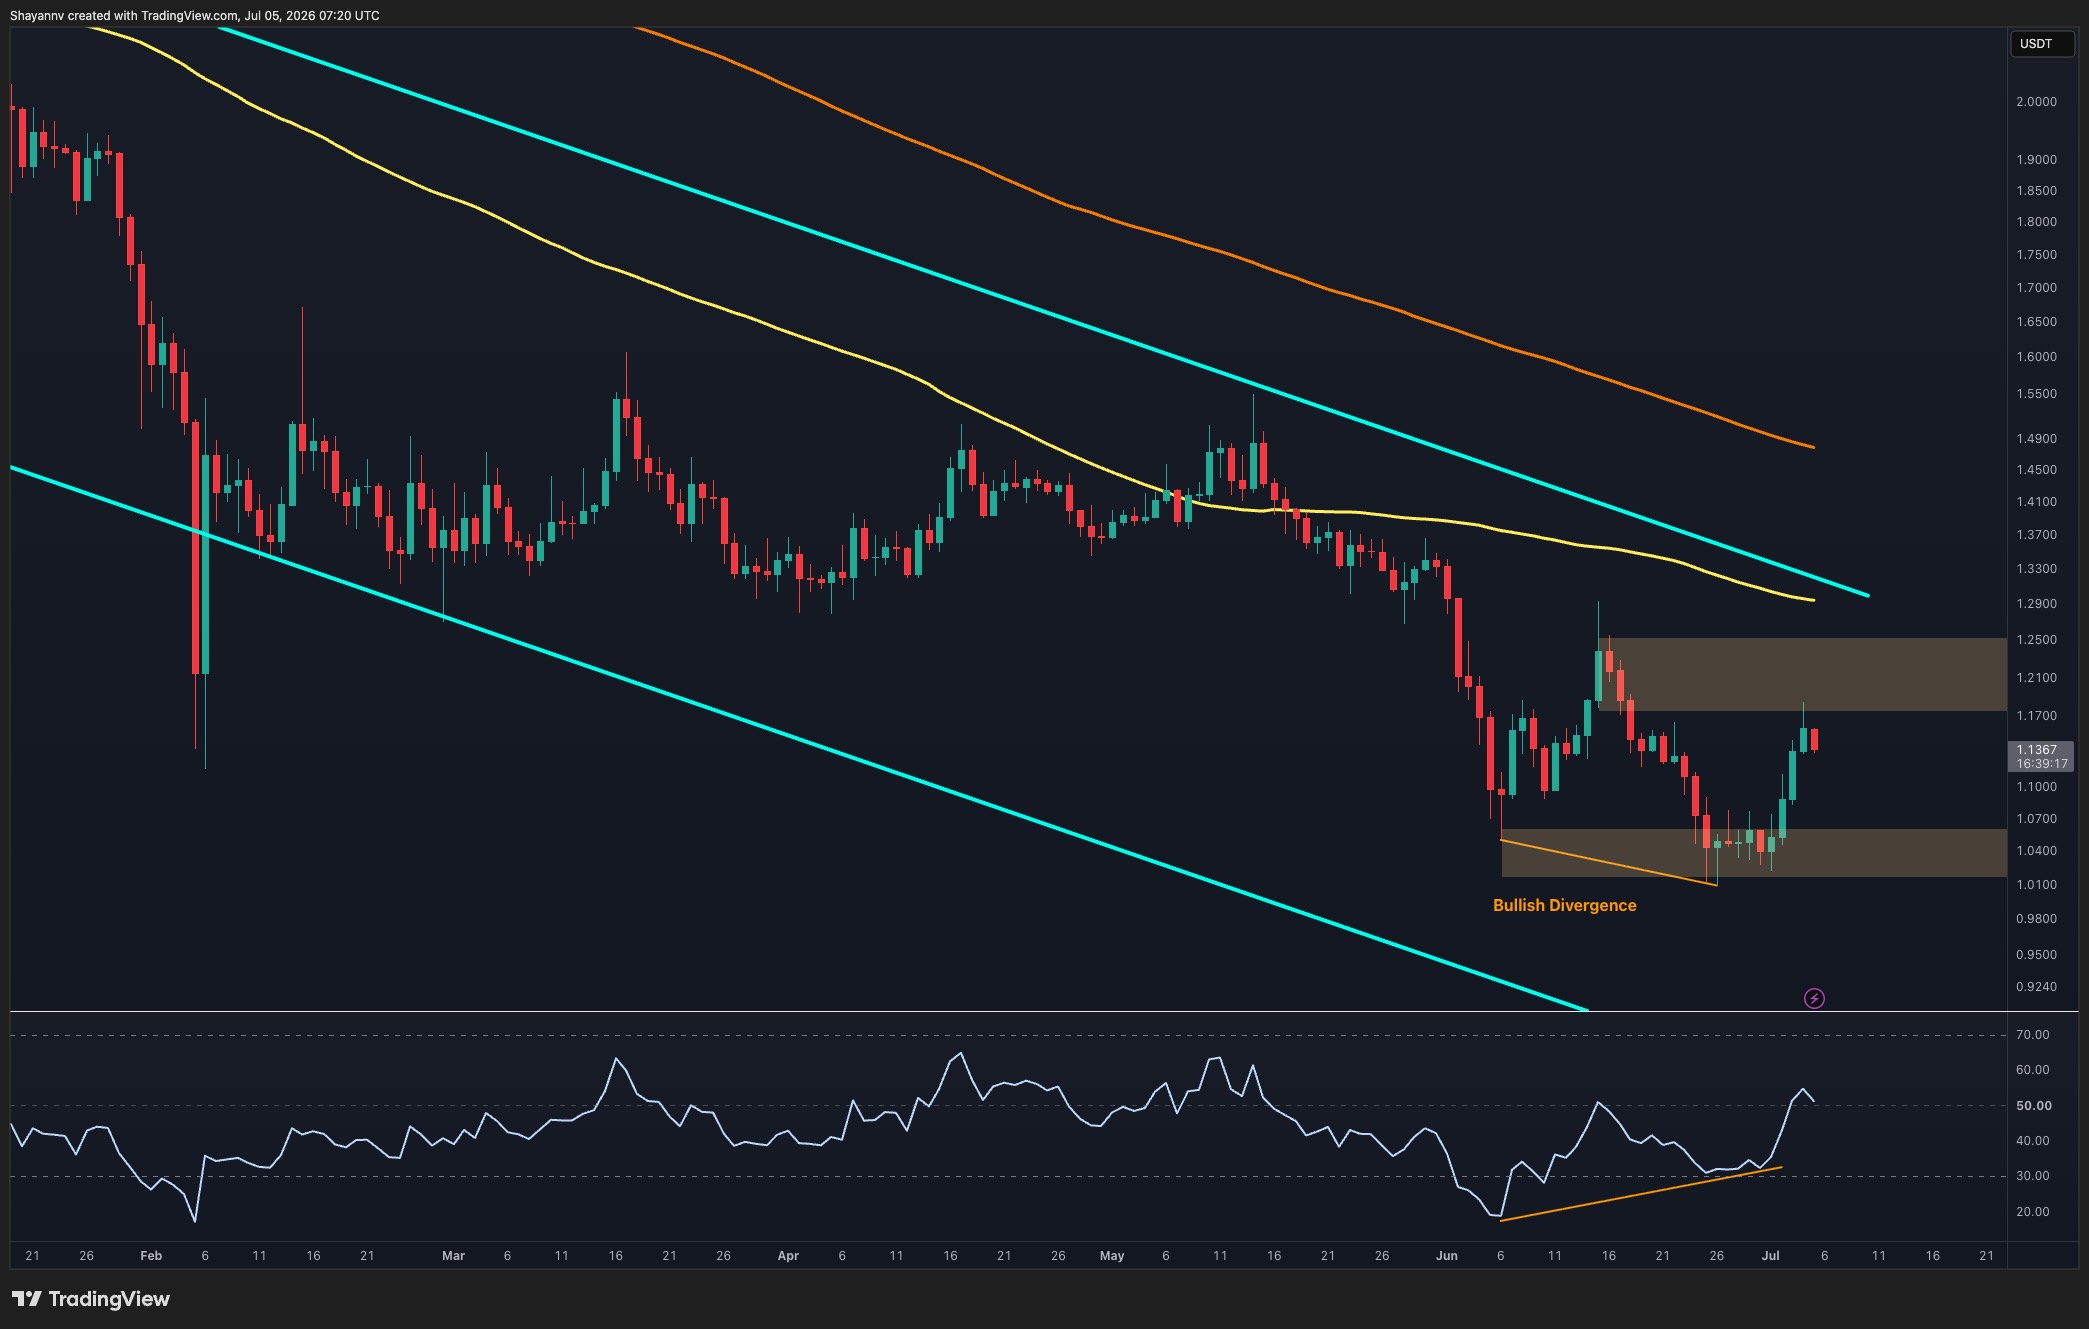
The daily timeframe continues to show XRP trading inside a long-term descending channel, remaining below the major moving averages and the channel’s upper boundary. Despite the broader bearish structure, the recent price action has improved considerably.
The bullish RSI divergence that formed around the $1.02-$1.05 support zone has played out as expected. While the asset was making lower lows, momentum was printing higher lows, signaling weakening selling pressure. Since then, XRP has rebounded sharply and reclaimed the lower support region around $1.02-$1.06.
The recovery has now carried the price toward the first major resistance zone between $1.17 and $1.24. This area previously acted as support before the latest breakdown and is now functioning as supply. The RSI has also pushed back above the midline, confirming improving momentum and strengthening the case for a continued recovery attempt.
However, the broader trend remains bearish as long as the token trades beneath the descending channel resistance and the major moving averages overhead. A successful reclaim of the $1.17-$1.24 region would be the first sign that the market is attempting to build a larger reversal structure.
XRP/USDT 4-Hour Chart
The 4-hour chart provides a clearer view of the recent breakout. XRP spent several days consolidating inside the $1.02-$1.06 demand zone before buyers aggressively stepped in and triggered a sharp rally toward the descending trendline resistance.
The move has already reclaimed the local support area and pushed price directly into the trendline that has capped lower highs since mid-June. XRP is now testing this dynamic resistance as it approaches the lower boundary of the broader $1.21-$1.29 supply zone.
This creates a pivotal setup. A confirmed breakout above the descending trendline would likely open the door for a move into the upper resistance region, where sellers may attempt to regain control. Such a breakout would also confirm a short-term structural shift after weeks of lower highs and lower lows.
On the other hand, failure to break through the trendline could trigger a temporary pullback toward the recently reclaimed support zone. As long as the asset remains above the $1.02-$1.06 area, the current recovery structure remains intact.
For now, momentum favors the bulls in the short term, but the market is approaching a major resistance cluster where a decisive breakout is needed to confirm that the recovery is evolving into something more significant than a relief rally.

Disclaimer: The content of this article solely reflects the author's opinion and does not represent the platform in any capacity. This article is not intended to serve as a reference for making investment decisions.
You may also like

Wall Street giants collectively raise rate hike forecasts, US Treasury futures continue to fall, gold drops over 1% to break 4000
After the US October CPI exceeded expectations, Goldman Sachs and Nomura added a forecast for an interest rate hike in March next year, while Deutsche Bank included a forecast for a rate hike in January next year. Currently, the market has fully priced in a 25 basis point rate hike in December, with a 13% probability for a 50 basis point hike. On Wednesday, the US Treasury spot market was closed, but Treasury futures continued to fall, with corresponding yields rising by about 2 to 4 basis points, and spot gold came under pressure, dropping by 1.1%.

No Need to Worry About the Cooling Down of AI Data Center Construction? The US Import Boom Is Unlikely to Subside in the Short Term, Real Impact May Come in 2029
It takes an average of 4.8 years from finalizing investment to starting construction of a data center project, and an additional 2.6 years from construction start to becoming operational. Servers usually cannot be installed until after the building structure and racks are completed. For trade partners such as Taiwan (China), South Korea, and Mexico who rely on US data center supply chain demand, the inertia in construction timelines provides at least a one- to two-year buffer for future exports.

Federal Reserve Major Debate: When Should the Tenure of “Number Three” Williams End?
The main point of contention is whether Williams should step down in June 2028, upon completing a full 10-year term, or in June 2027, when he reaches the mandatory retirement age of 65. Analysts point out that the Federal Reserve Board holds ultimate discretion; if he leaves early, Fed Chair Waller would be able to assert greater control over the appointment to this critical position. However, forcing Williams to shorten his term could easily be interpreted as political manipulation. Williams himself is expected to serve until June 2028.

Crypto prices
More


