Ethereum’s monthly TD Sequential indicator reignited optimism after printing its first bullish trigger since March 2025.
Previous monthly buy signals had preceded rallies of 235% in 2022 and 182% in 2025, making the latest signal difficult to ignore.
However, the indicator only suggested that Ethereum could have approached another macro turning point rather than confirming a new bull market.
Historical performance alone does not guarantee a similar outcome because broader market conditions differ across cycles.
Leverage returned as bullish conviction increased
Derivatives activity reflected renewed confidence as traders increased their exposure to Ethereum.
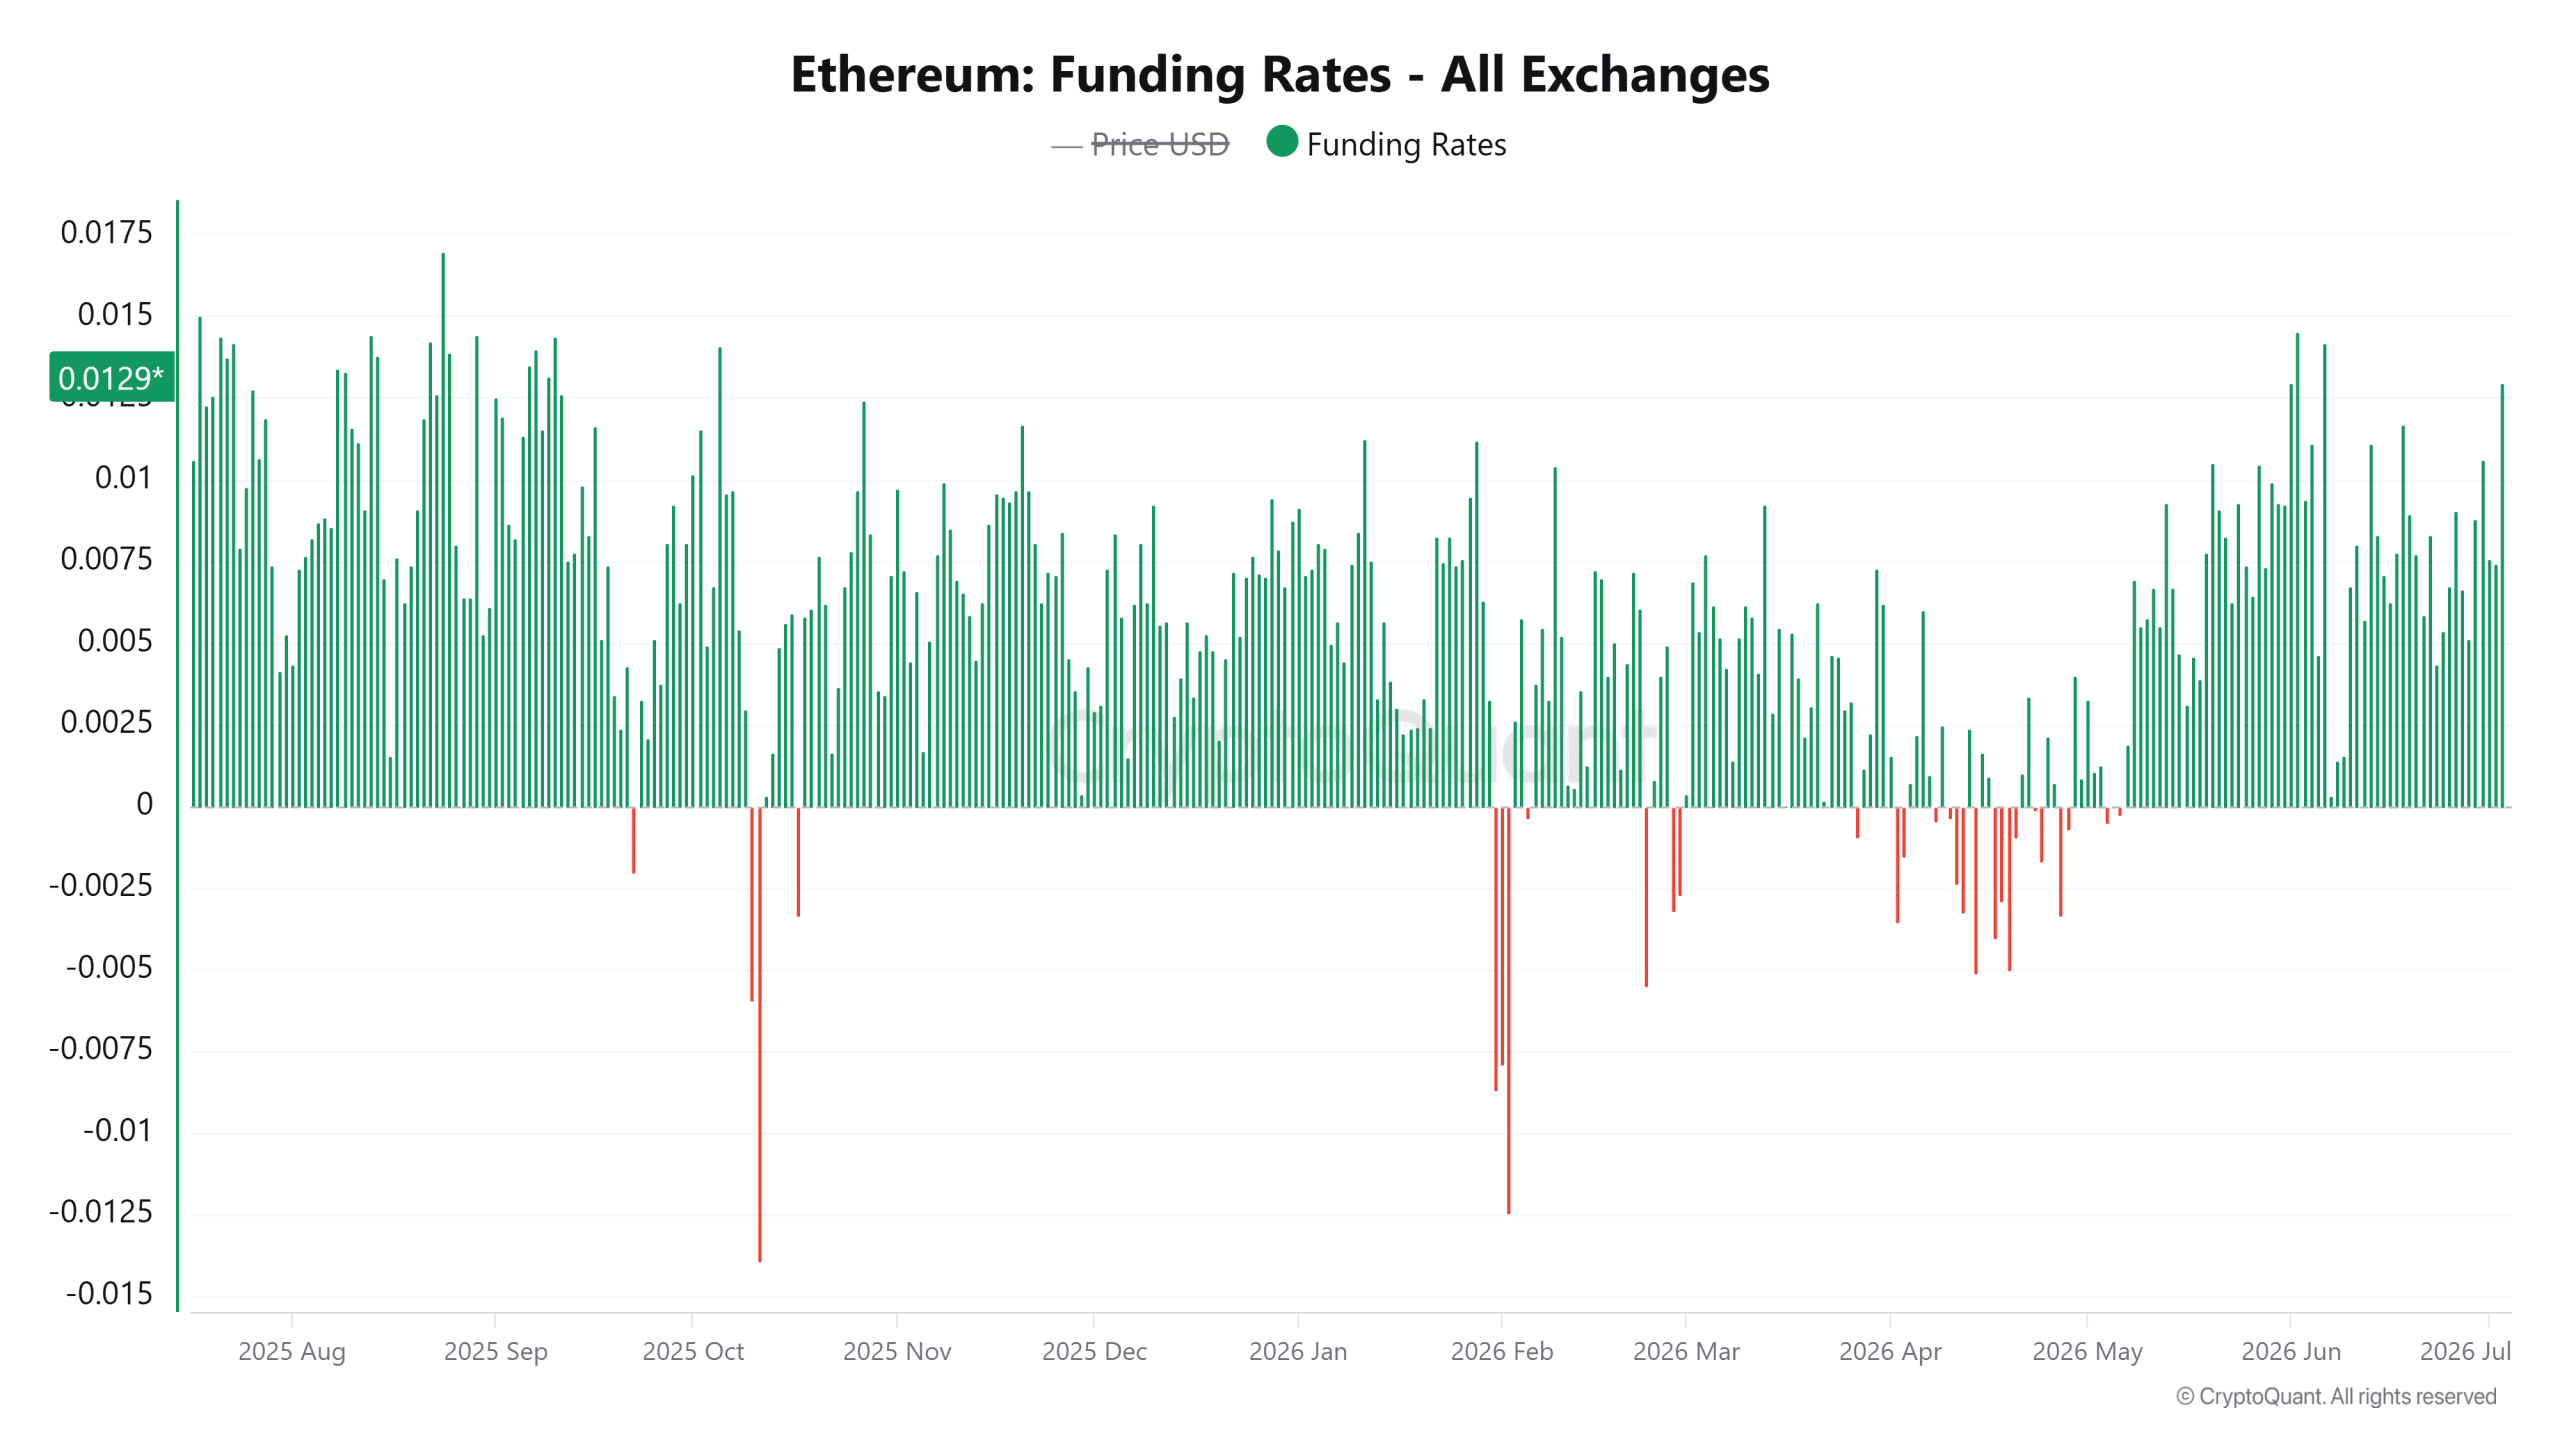
At the time of writing, Open Interest had climbed to 11.16B, recording a 13.15% daily increase, while Funding Rates surged 113.86% to 0.0129.
Those figures showed that leveraged long positions expanded during the latest recovery instead of remaining on the sidelines.
However, rising leverage also increased liquidation risk if Ethereum failed to maintain its recent gains.
Positive funding indicated that long traders paid a premium to hold their positions, reinforcing the bullish bias across perpetual futures markets.
However, derivatives data alone did not validate the monthly TD Sequential signal.
Rather, it showed that speculative demand had returned, leaving price action responsible for confirming whether buyers could sustain the growing optimism.
 Source: CryptoQuant
Ethereum double-bottom recovery faces major resistance
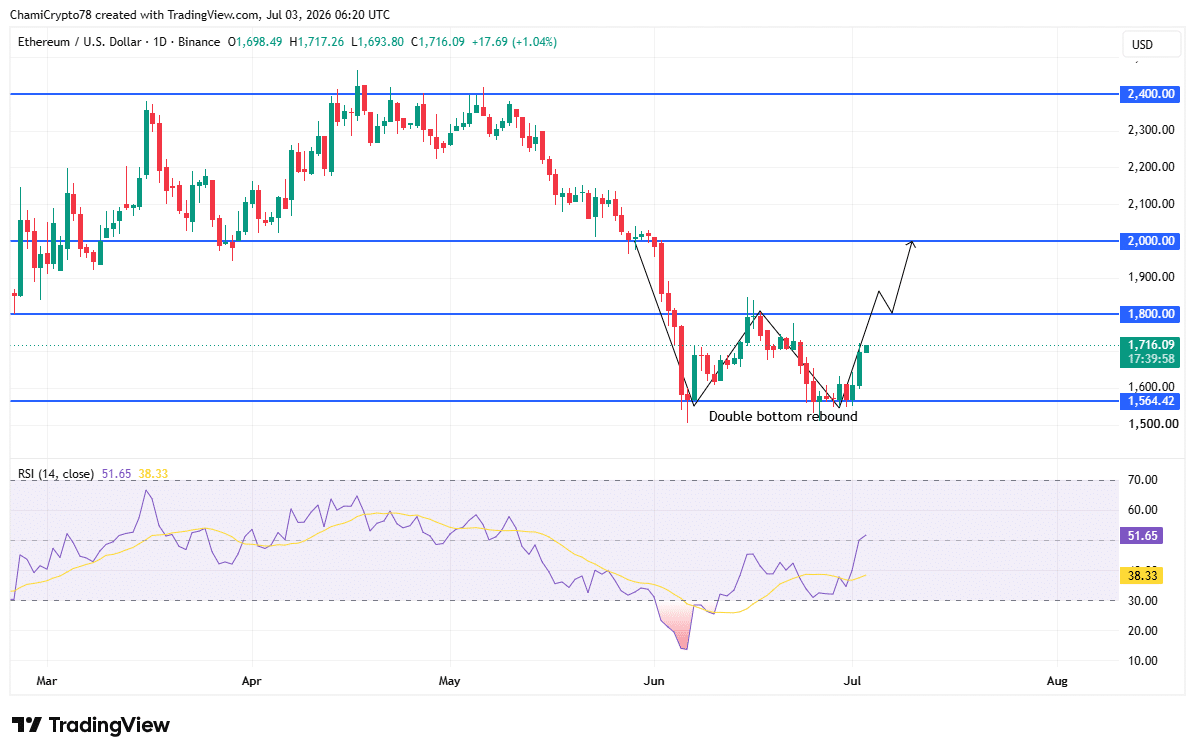
Ethereum [ETH] rebounded from a well-defined double-bottom near $1,565 after buyers repeatedly defended that support level.
The recovery pushed the price above $1,700, placing the next technical barrier around $1,800, while $2,000 remained the next major resistance if buying pressure persisted.
RSI also climbed to 51.65, recovering above the neutral level after rebounding from deeply oversold conditions.
That shift reflected improving buying strength rather than weakening demand.
Even so, Ethereum continued trading below its major resistance zones despite reclaiming short-term support.
The current structure suggested buyers had regained control following the correction.
Still, only a decisive break above $1,800 would strengthen the case that the monthly TD Sequential signal aligned with a broader trend reversal instead of another short-lived recovery.
 Source: TradingView
Liquidity map points toward the next target
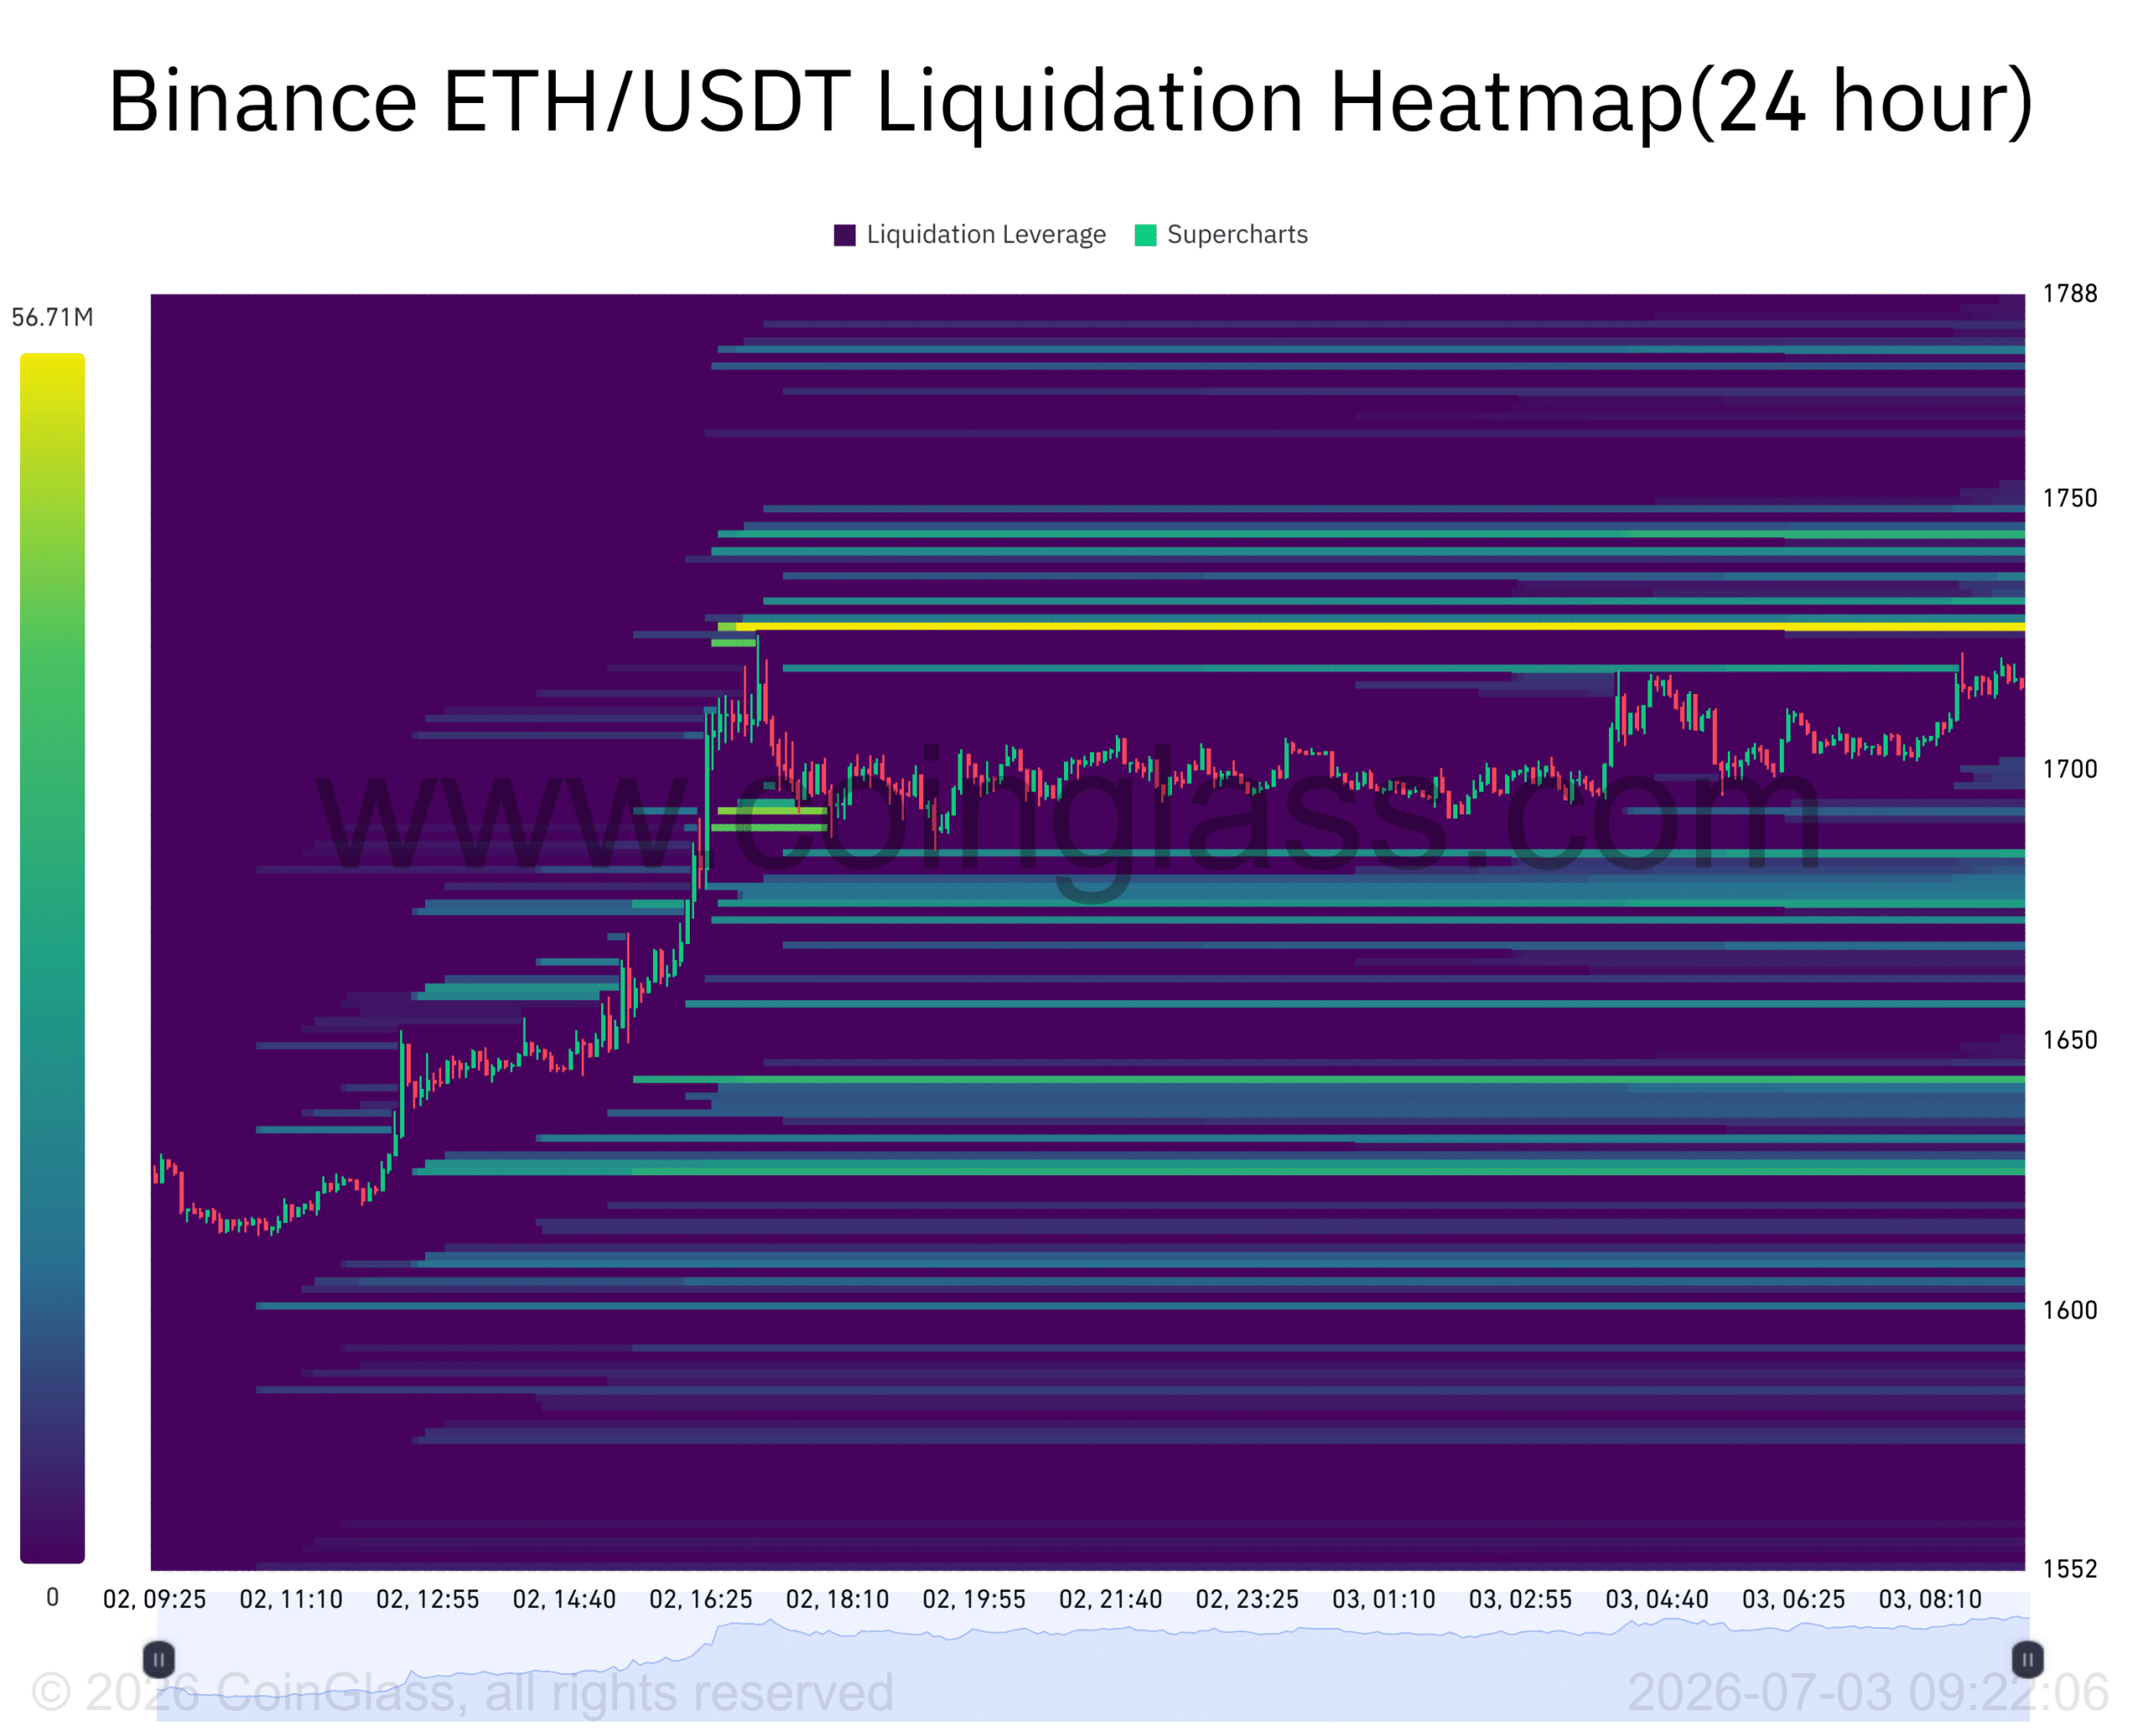
The 24-hour Liquidation Heatmap showed the largest concentration of leveraged positions around $1,740-$1,750.
This placed a significant liquidity cluster directly above Ethereum’s current price.
Markets often gravitate toward heavily leveraged zones because liquidations create additional trading activity.
As a result, Ethereum retained room for another short-term advance before confronting stronger resistance near $1,800.
Meanwhile, another notable liquidity pocket remained around $1,680-$1,650, leaving downside volatility possible if buyers surrendered control.
The current distribution favored an attempt to sweep overhead liquidity first.
However, the heatmap highlighted areas of interest rather than guaranteeing direction, meaning Ethereum still needed a confirmed breakout to reinforce the broader bullish thesis.
 Source: CoinGlass
Conclusively, the monthly TD Sequential buy signal revived the long-term bullish outlook, but it did not confirm that Ethereum had entered a new macro uptrend.
The double-bottom recovery, RSI improvement, and rising derivatives activity supported the bullish proposition.
However, Ethereum would likely need to reclaim $1,800 before the technical structure fully aligned with the indicator.
Until then, the recovery remained constructive, but confirmation would depend on buyers overcoming nearby resistance rather than relying on the historical success of the monthly signal alone.
Final Summary
-
Ethereum recovered from a double bottom while bulls targeted the $1,800 resistance level.
-
Rising leverage supported bullish sentiment, though resistance still required decisive confirmation.