Bitget App
Trade smarter
Buy cryptoMarketsTradeFuturesStocksEarnInstitutionAI & More
The $75 line in the sand: Hyperliquid approaches a key decision point

The $75 line in the sand: Hyperliquid approaches a key decision point

AMBCryptoAMBCrypto2026/07/03 22:33
By:AMBCrypto

Since October 2025, Bitcoin [BTC] and most of the altcoins have been trending downward. Many alts, even prominent ones, never really got a long-term uptrend going. The price gains in the past couple of days for BTC and other tokens were only a bounce within a downtrend.

Hyperliquid [HYPE] was one of the large-cap tokens whose long-term trend was firmly bullish.
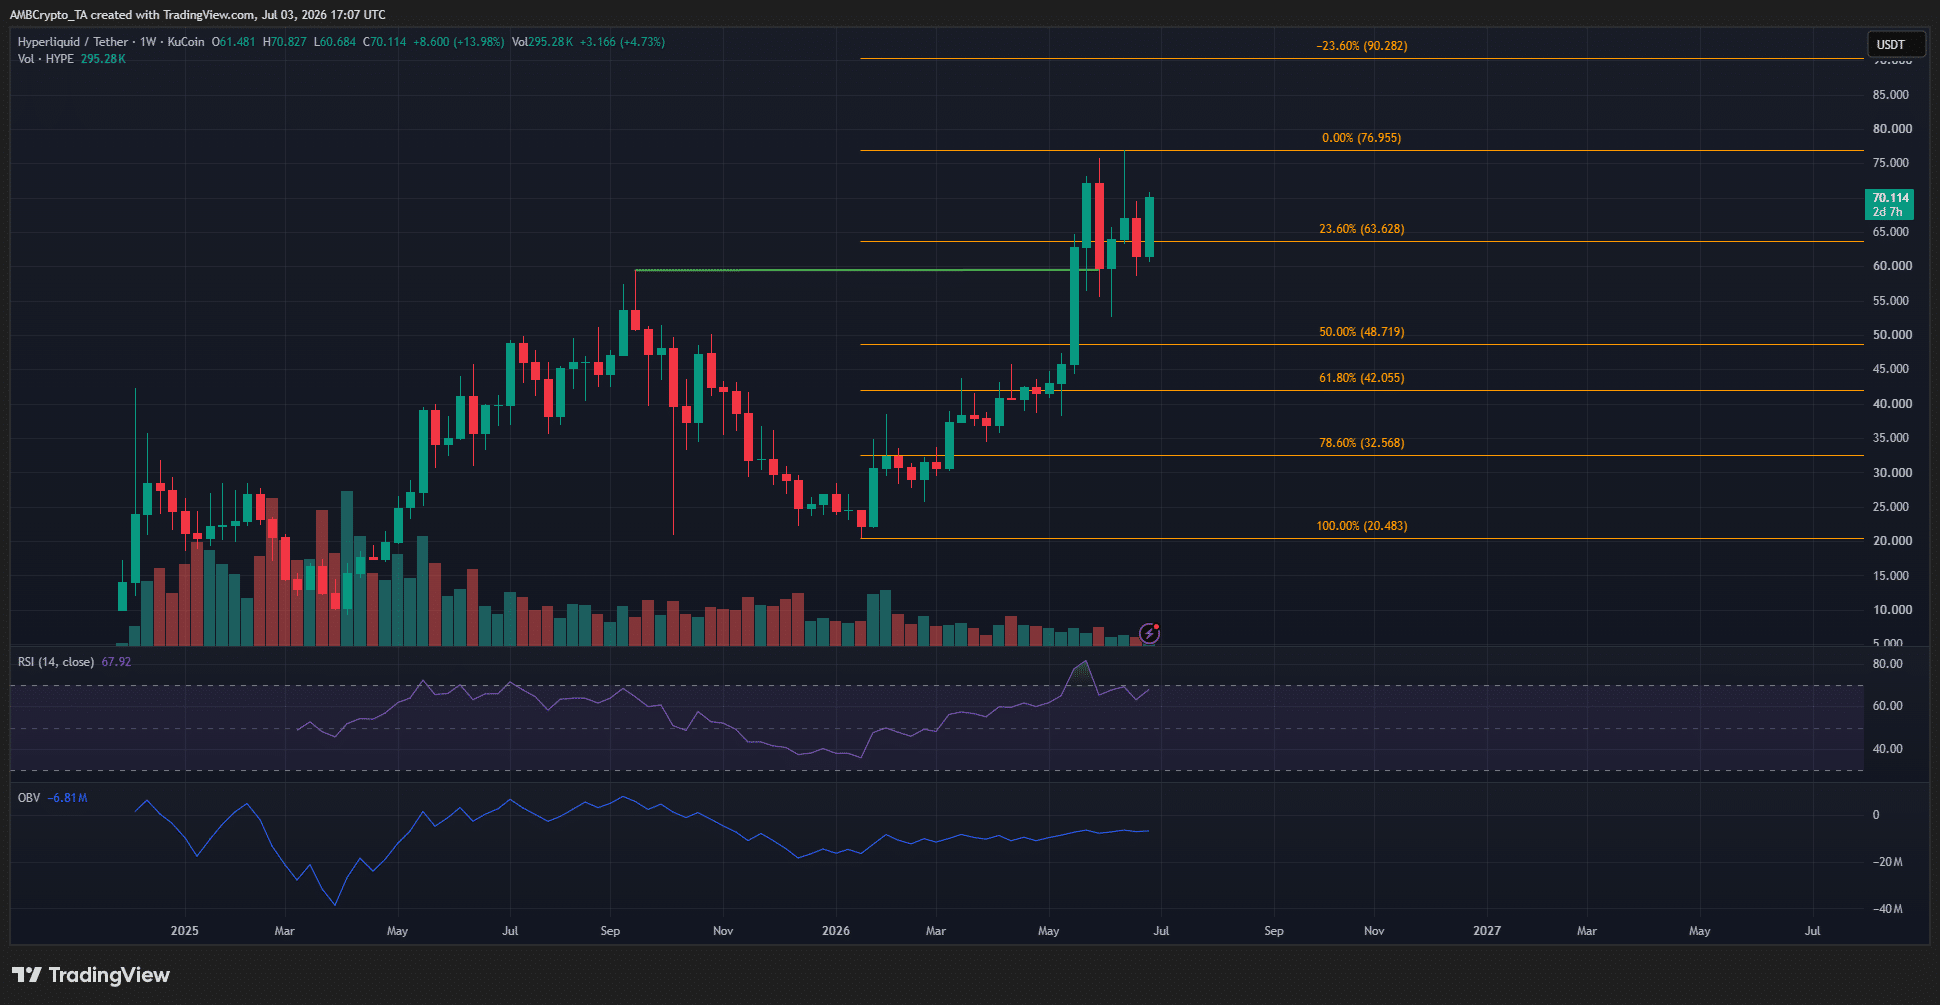
The $75 line in the sand: Hyperliquid approaches a key decision point image 0 Source: HYPE/USDT on TradingView

As the 1-week chart above highlights, the swing structure has been bullish for more than a year. It was trading at $70.11, and was up 7.51% in the past week and over 74% up in a year.

@media only screen and (min-width: 0px) and (min-height: 0px) { div[id^="bsa-zone_1774359638628-7_123456"] { min-height: 50px; transition: min-height 0.3s ease; } } @media only screen and (min-width: 640px) and (min-height: 0px) { div[id^="bsa-zone_1774359638628-7_123456"] { min-height: 90px; } }
AD

This cemented the long-term bullish trend, but the RSI was forming lower highs in recent weeks while HYPE bulls tried to push prices to new highs. Hence, a weekly session move beyond $72.1 would present a bearish divergence, though it doesn’t guarantee an immediate correction.

Here’s what traders and investors can expect from Hyperliquid token’s price action.

HYPE price prediction for July
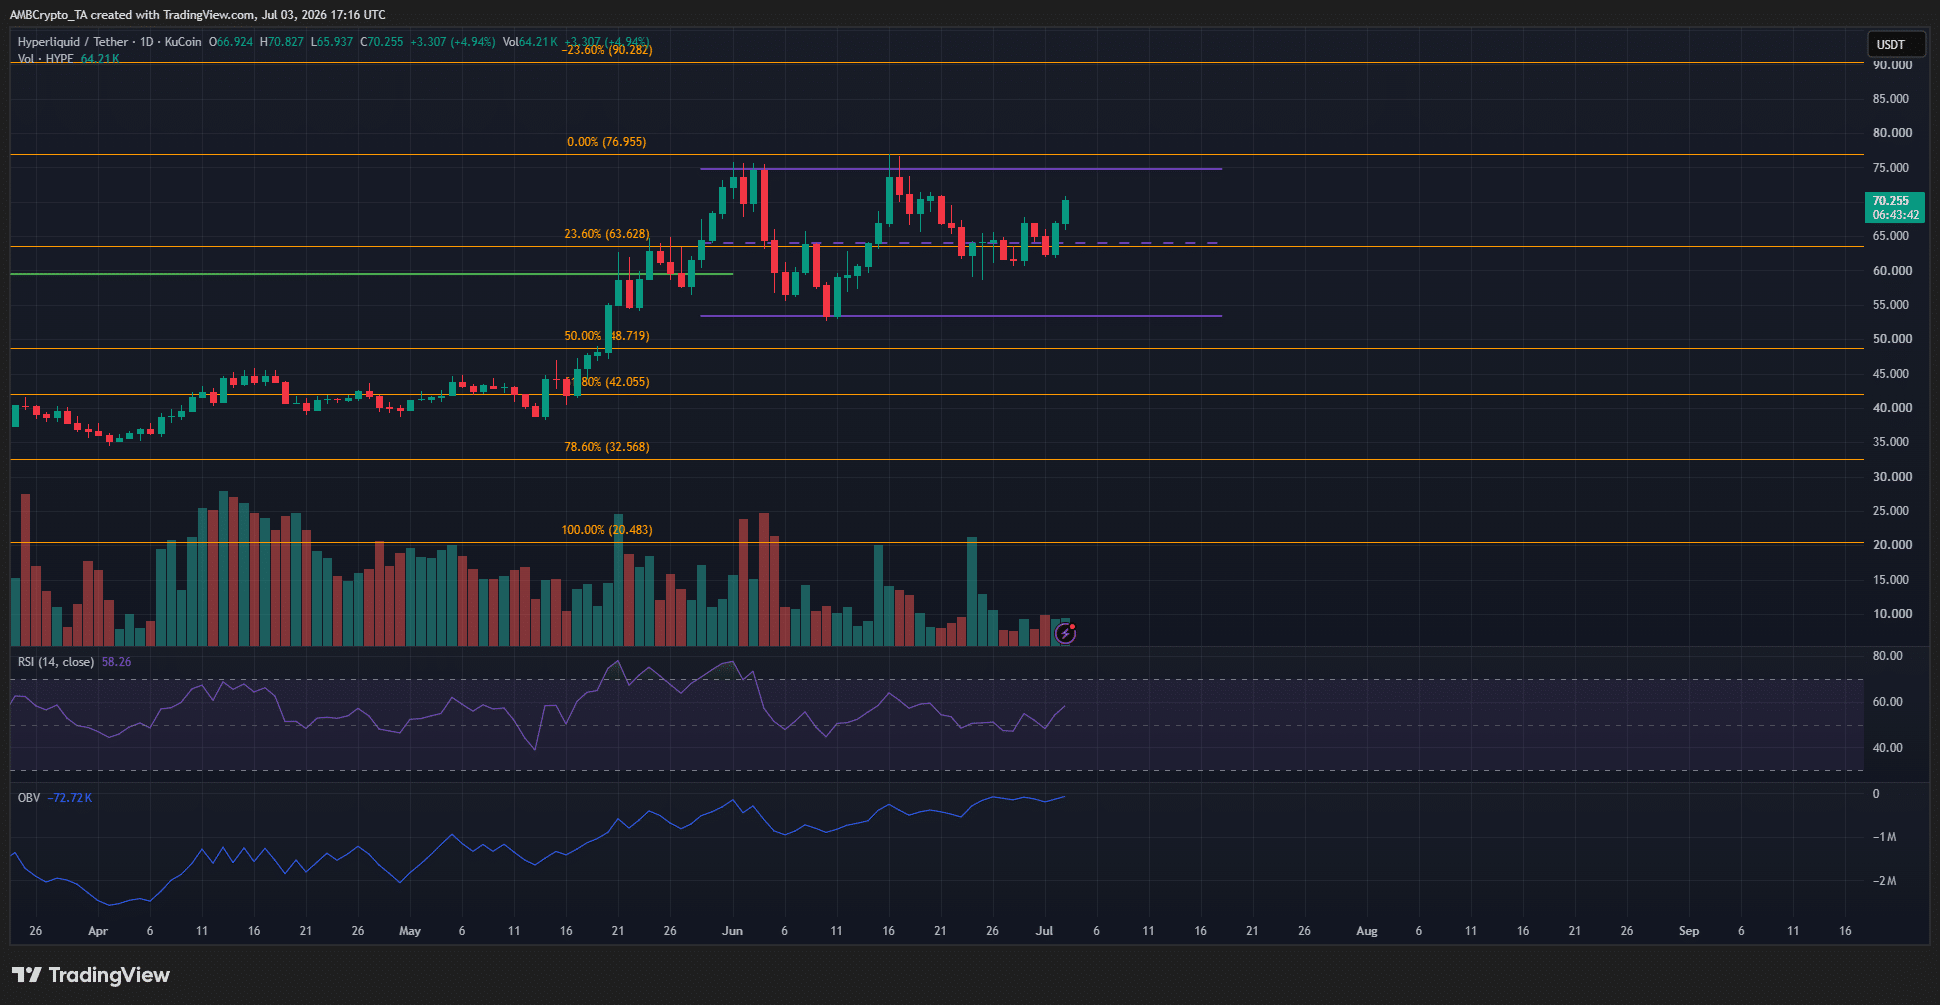
The $75 line in the sand: Hyperliquid approaches a key decision point image 1 Source: HYPE/USDT on TradingView

Over the past month of trading, the DEX token has formed a range [purple] between $53.35 and $74.78. At the time of writing, the price was above the mid-range resistance at $64.1 and also the short-term resistance zone at $67.2.

This upward push came despite some profit-taking by whales. The selling was being absorbed by the demand in the market.

Combined with the recent bullish momentum for Bitcoin, it appeared likely that HYPE can continue higher toward $75.

The OBV was climbing steadily, and the RSI remained above neutral 50. Together, they signaled steady buying pressure and intact bullish momentum.

Traders’ call to action- Wait
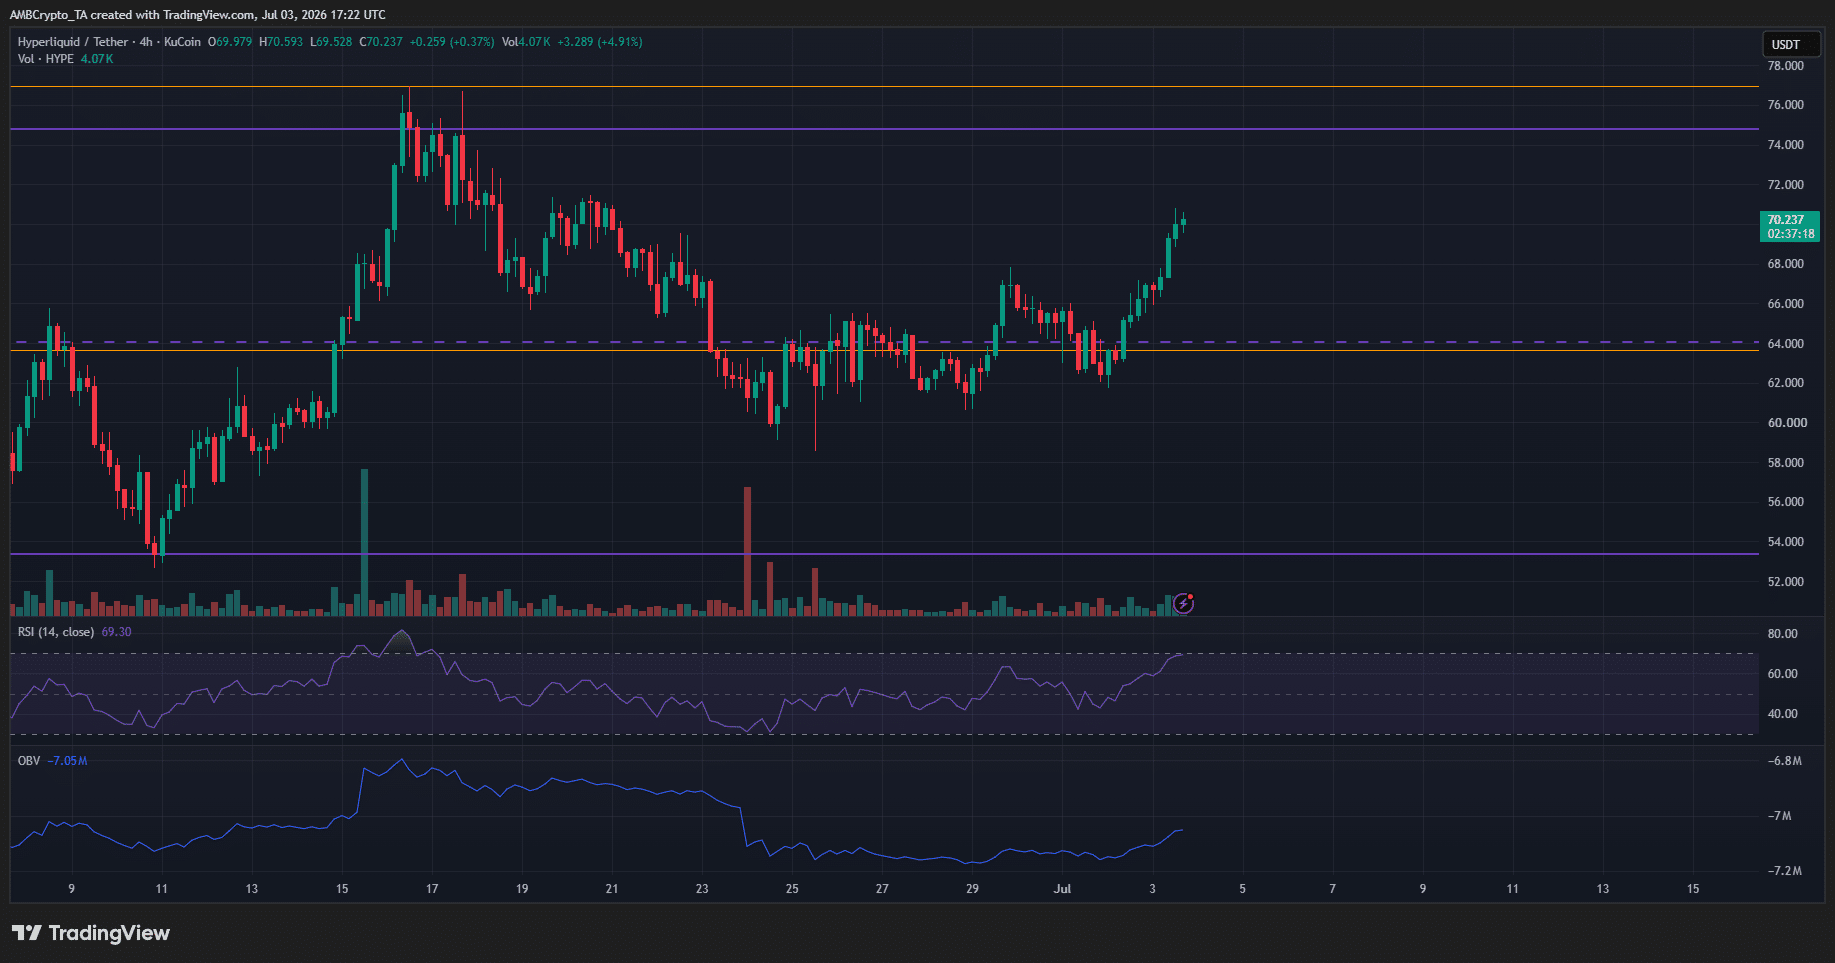
The $75 line in the sand: Hyperliquid approaches a key decision point image 2 Source: HYPE/USDT on TradingView

The range formation needs to be cleared for the next decisive higher timeframe move. Within this range, a test of either extreme can offer swing traders an opportunity to enter.

Right now, this opportunity was not at hand. The risk-to-reward was not ideal for swing traders at the time of writing.

The technical indicators favored short-term upside. Therefore, a move toward the $75 supply zone and a bearish reaction from there can be used to sell the token, targeting the mid-range and range-low support levels.

Final Summary

  • Hyperliquid was one of the only large-cap crypto assets that maintained a long-term bullish trend.
  • The $75 supply zone was vital for swing traders. A breakout past, or a rejection from, this area would be a signal for traders to place directional bets.


 

0
0

Disclaimer: The content of this article solely reflects the author's opinion and does not represent the platform in any capacity. This article is not intended to serve as a reference for making investment decisions.

Understand the market, then trade.
Bitget offers one-stop trading for cryptocurrencies, stocks, and gold.
Trade now!

You may also like

Wall Street giants collectively raise rate hike forecasts, US Treasury futures continue to fall, gold drops over 1% to break 4000

After the US October CPI exceeded expectations, Goldman Sachs and Nomura added a forecast for an interest rate hike in March next year, while Deutsche Bank included a forecast for a rate hike in January next year. Currently, the market has fully priced in a 25 basis point rate hike in December, with a 13% probability for a 50 basis point hike. On Wednesday, the US Treasury spot market was closed, but Treasury futures continued to fall, with corresponding yields rising by about 2 to 4 basis points, and spot gold came under pressure, dropping by 1.1%.

华尔街见闻•2026/11/11 21:18
Wall Street giants collectively raise rate hike forecasts, US Treasury futures continue to fall, gold drops over 1% to break 4000

No Need to Worry About the Cooling Down of AI Data Center Construction? The US Import Boom Is Unlikely to Subside in the Short Term, Real Impact May Come in 2029

It takes an average of 4.8 years from finalizing investment to starting construction of a data center project, and an additional 2.6 years from construction start to becoming operational. Servers usually cannot be installed until after the building structure and racks are completed. For trade partners such as Taiwan (China), South Korea, and Mexico who rely on US data center supply chain demand, the inertia in construction timelines provides at least a one- to two-year buffer for future exports.

华尔街见闻•2026/11/11 21:18
No Need to Worry About the Cooling Down of AI Data Center Construction? The US Import Boom Is Unlikely to Subside in the Short Term, Real Impact May Come in 2029

Federal Reserve Major Debate: When Should the Tenure of “Number Three” Williams End?

The main point of contention is whether Williams should step down in June 2028, upon completing a full 10-year term, or in June 2027, when he reaches the mandatory retirement age of 65. Analysts point out that the Federal Reserve Board holds ultimate discretion; if he leaves early, Fed Chair Waller would be able to assert greater control over the appointment to this critical position. However, forcing Williams to shorten his term could easily be interpreted as political manipulation. Williams himself is expected to serve until June 2028.

华尔街见闻•2026/11/11 21:18
Federal Reserve Major Debate: When Should the Tenure of “Number Three” Williams End?

