BUILDon attracted renewed market attention after its price climbed 20% to $0.2510 in 24 hours, while trading volume surged 181.98% to $10.9 million.
The rally reflected stronger participation across both spot and derivatives markets rather than isolated buying activity.
As a result, the token’s market capitalization increased to $248.61 million, reinforcing the broader recovery.
In addition, the Vol/Mkt Cap ratio rose to 4.15%, indicating that trading activity accelerated relative to the token’s overall valuation.
This combination of rising price, expanding volume, and improving participation placed BUILDon [B] among the session’s strongest performers. That momentum shifted attention to whether buyers could sustain the latest advance.
Why is Open Interest rising?
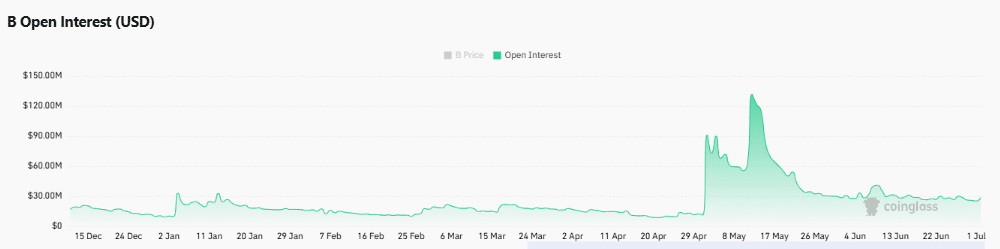
Derivatives traders increased their exposure as Open Interest rose 21.29% to $30.60 million alongside the latest price recovery.
The increase suggests new positions entered the market instead of existing contracts merely changing hands.
Unlike rallies driven by declining leverage, BUILDon’s advance developed while speculative participation expanded, reflecting stronger conviction among futures participants.
However, the increase remained relatively measured compared with the sharp rise in spot volume, reducing immediate concerns about excessive leverage.
Meanwhile, both metrics advanced together, indicating that derivatives activity supported the broader market move.
However, sustained participation from both spot and futures markets would remain necessary for the rally to continue building.
 Source: CoinGlass
Has BUILDon started building for a breakout?
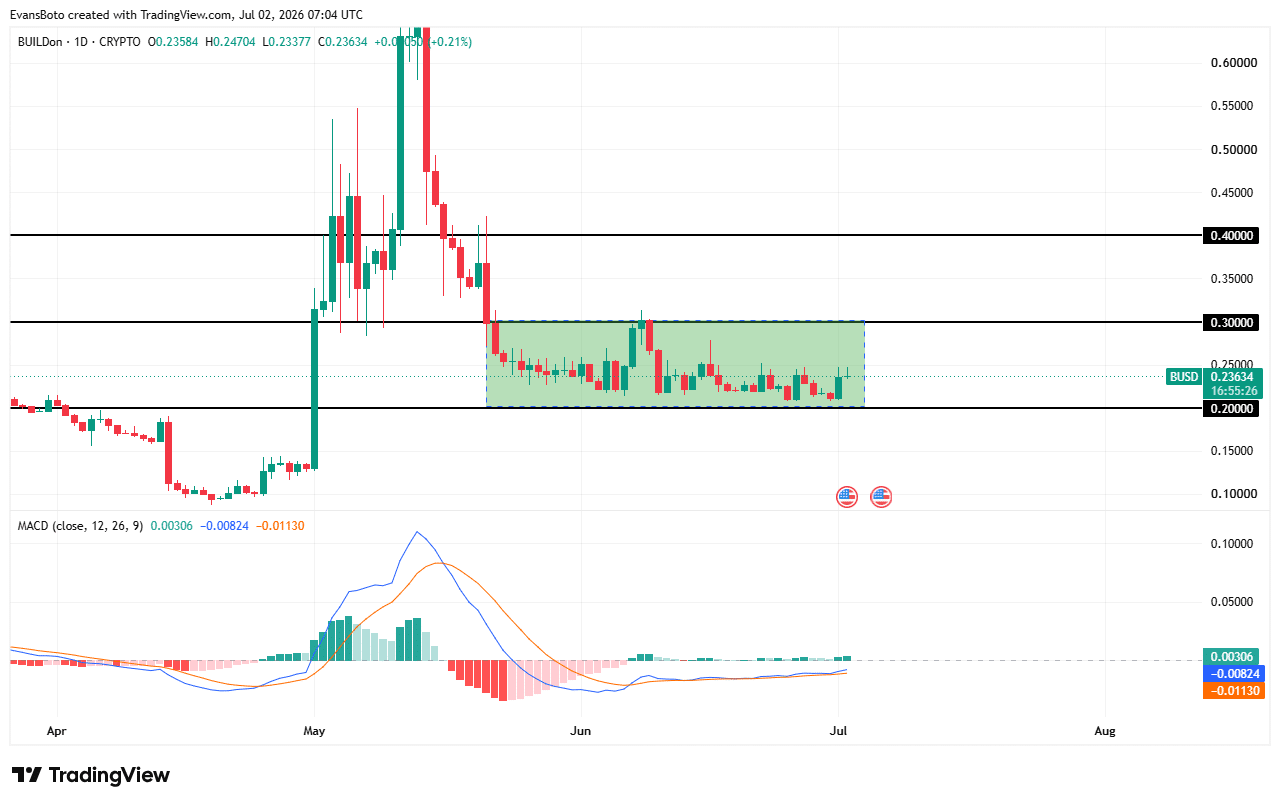
BUILDon continued holding above the $0.20 support after spending several weeks consolidating inside the $0.20 to $0.30 range.
That consolidation followed the sharp decline from May’s highs and gradually compressed price action.
Meanwhile, the MACD confirmed a bullish crossover as the MACD line crossed above the signal line, while the histogram remained in positive territory and continued expanding. These signals indicated that buying strength had gradually increased during the consolidation phase.
In addition, repeated defenses of the lower boundary suggested sellers had failed to force another breakdown despite several attempts.
If this structure continues developing, the strengthening technical picture would favor an upside resolution, with $0.30 remaining the key breakout level before a potential move toward $0.40.
 Source: TradingView
Where could liquidation pressure emerge next?
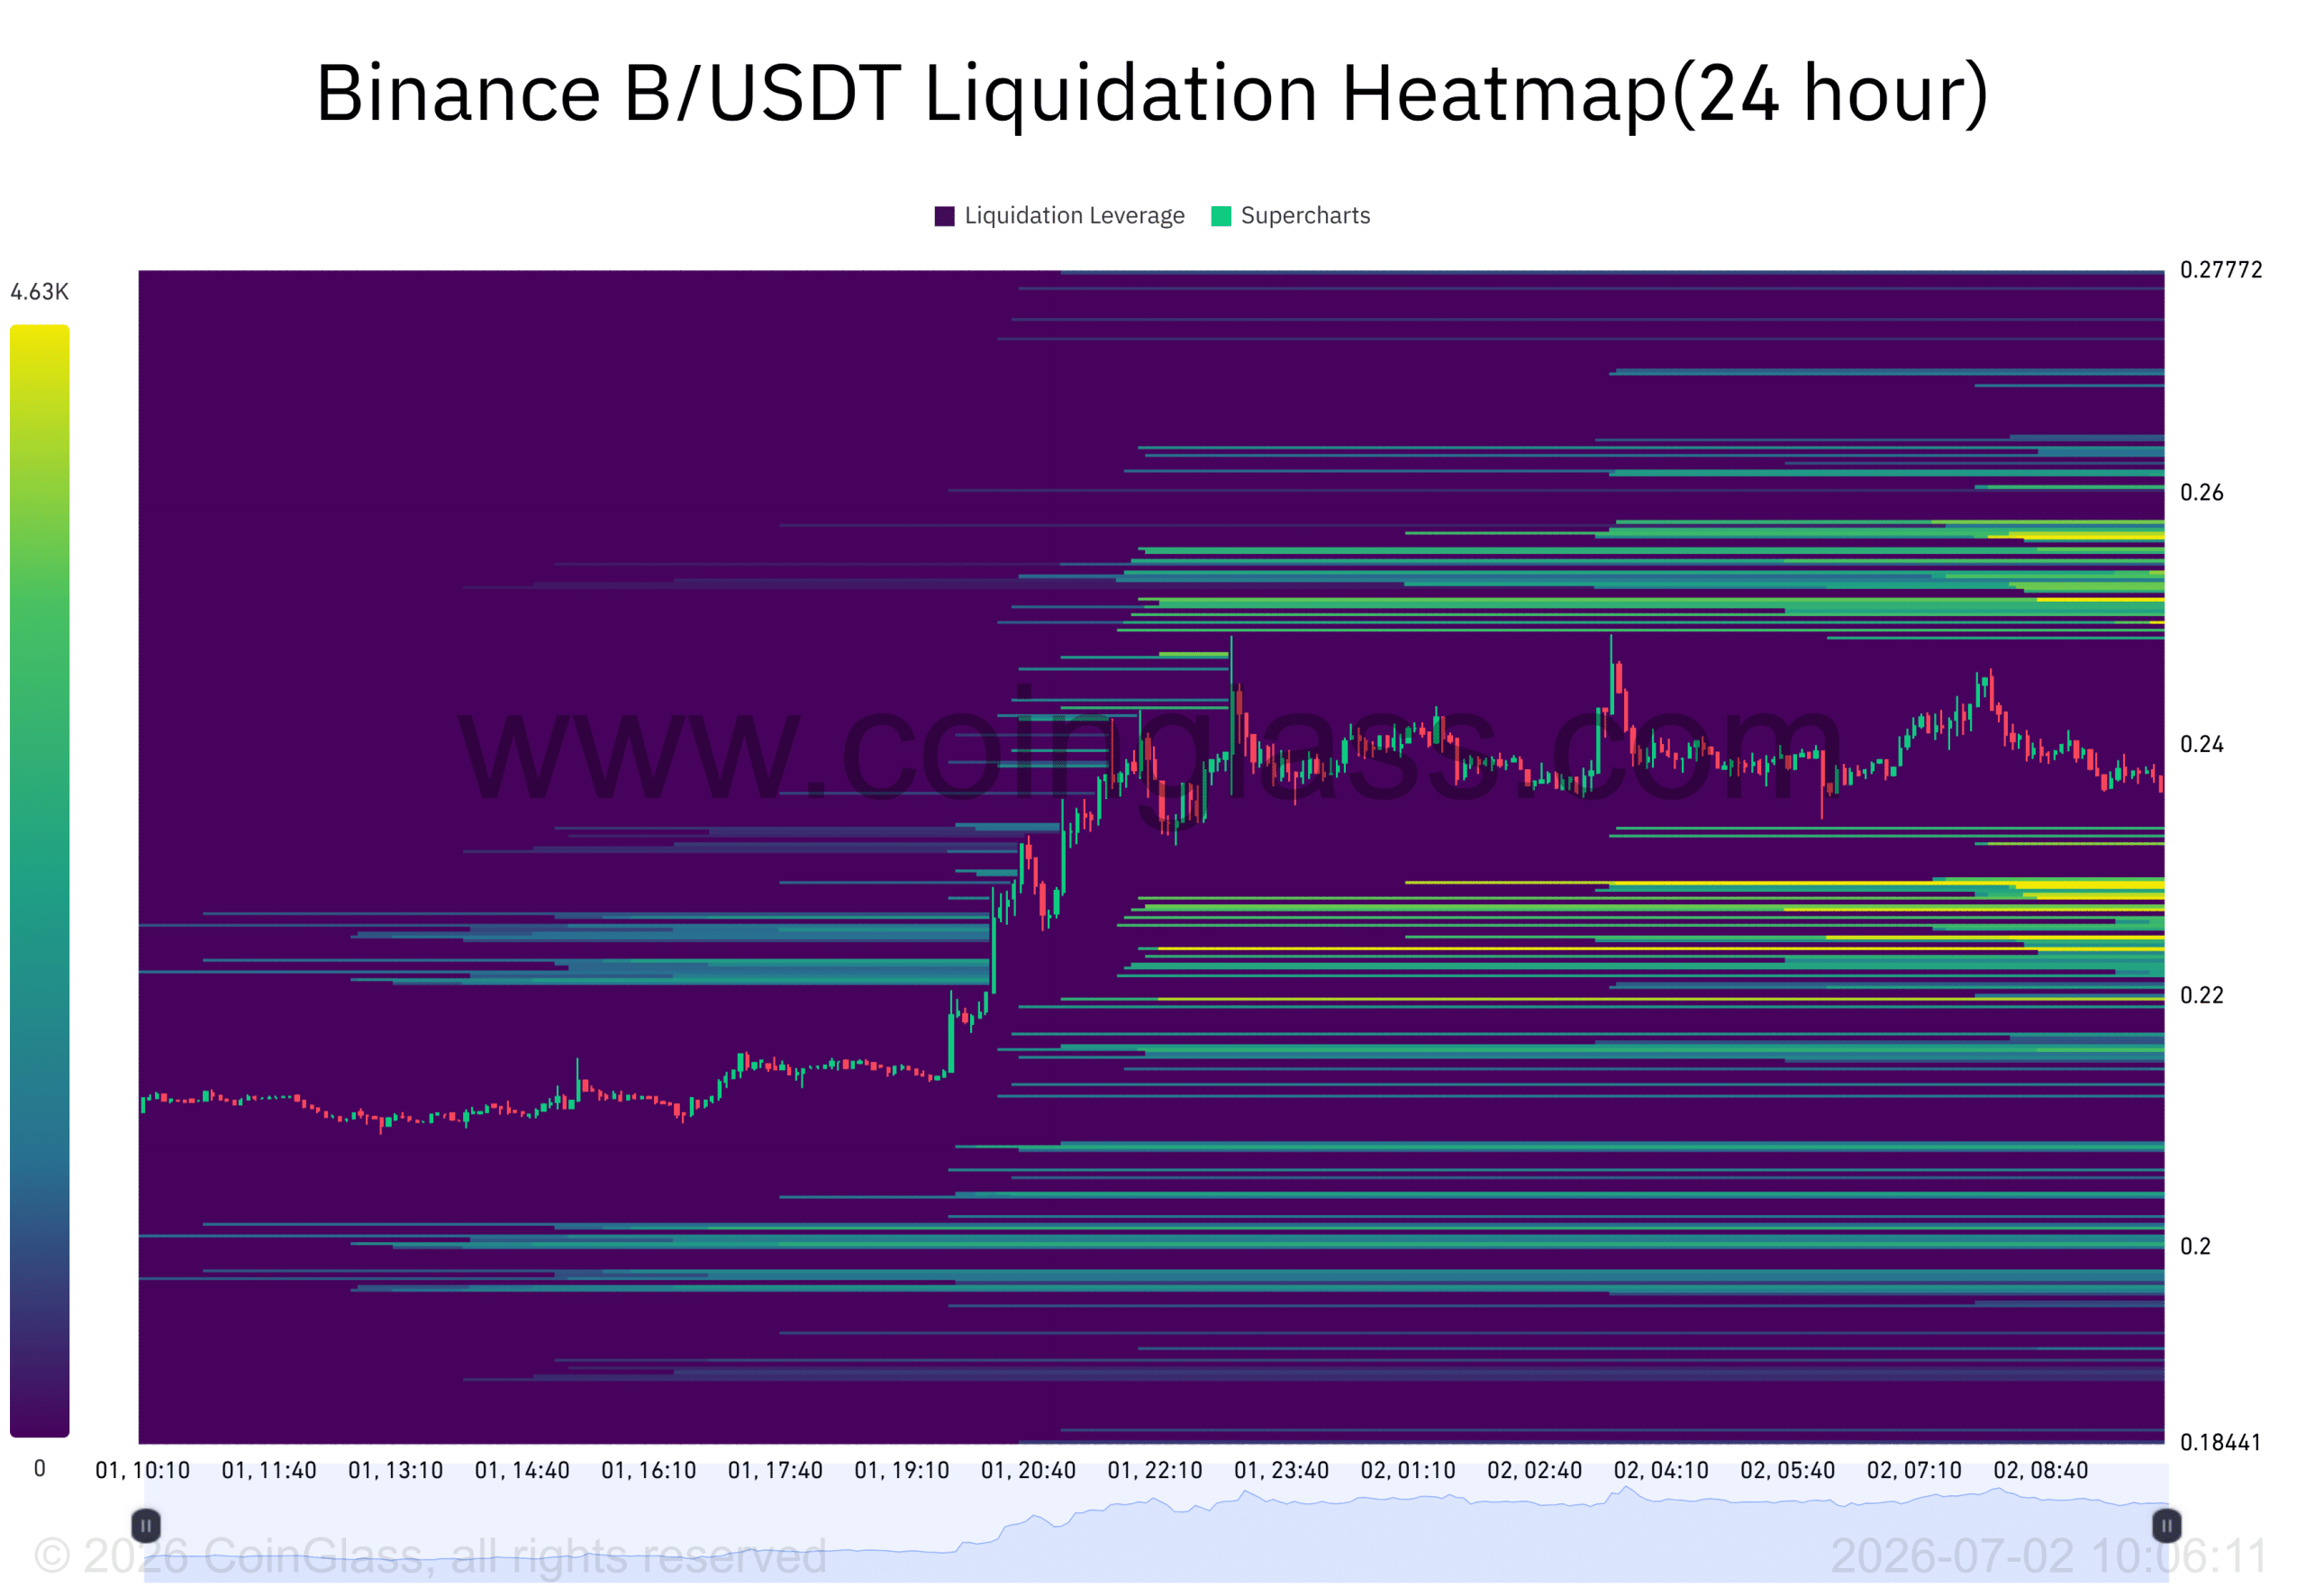
The Binance Liquidation Heatmap highlighted dense liquidity clusters on both sides of the current price, indicating that volatility could increase once either level attracted sufficient trading activity.
The strongest concentration above price sat around the $0.25 to $0.26 region, making that area the nearest upside liquidity target before any attempt toward higher resistance.
Below the market, another significant cluster formed around the $0.22 to $0.23 region, creating an important downside liquidity zone if sellers regained temporary control.
By contrast, the nearest liquidity concentration remained above the price, suggesting buyers may target that area first if momentum continues. That left traders watching whether price could clear nearby liquidity before testing broader resistance.
 Source: CoinGlass
Can BUILDon break above the $0.30 range ceiling?
BUILDon would likely break above the $0.30 range ceiling if the current structure continued developing.
The confirmed MACD bullish crossover, expanding positive histogram, and repeated defenses of the $0.20 support indicated buyers had gradually regained control after weeks of consolidation.
Those conditions favored an upside resolution over another prolonged range, making a breakout above $0.30 the more probable next major move.
Final Summary
- BUILDon’s rally coincided with higher spot activity and rising Open Interest, pointing to broader market participation.
- The next test lies near $0.30, where buyers must overcome a key resistance level.