invezz.com

Driven by thin liquidity and speculative trading, MemeCore (M) price briefly surpassed $5 over the past 24 hours, extending its recovery after rebounding from recent multi-month lows.
According to CoinGecko data, M climbed to around $5.58 during Thursday's session after spending most of the previous day trading near the $1.20 level.
The move followed a sharp intraday breakout that triggered widespread short liquidations and coincided with improving sentiment across the broader cryptocurrency market as Bitcoin reclaimed the key $60,000 level.
Bitcoin's recovery provided the first catalyst by drawing liquidity back into higher-risk digital assets.
The return above the closely watched psychological level encouraged traders to rotate into heavily sold tokens, helping MemeCore recover from the steep losses it suffered over the past week.
Confidence also improved after the MemeCore development team issued a public statement addressing the extreme price volatility.
While the statement did not directly resolve insider manipulation allegations previously raised by on-chain investigator ZachXBT, it reassured parts of the market that development on the project would continue.
The response helped slow panic selling and encouraged speculative buyers to re-enter the market.
At the same time, derivatives data show the rally quickly evolved into a short squeeze.
CoinGlass data recorded roughly $1.42 million in total liquidations over the past 24 hours, with nearly $968,000 coming from short positions compared with about $449,000 from longs.
The imbalance suggests bearish traders were forced to buy back positions as prices accelerated higher, adding further momentum to the advance.
Technical conditions also favored a rebound.
After the token previously dropped as low as $0.51, momentum indicators had entered deeply oversold territory, creating conditions where algorithmic buying and short covering could amplify even modest demand.
MemeCore's relatively thin on-chain liquidity further increased price sensitivity, allowing buying pressure to produce unusually large percentage gains.
However, it must be noted that such swings can happen both ways.
Can the MemeCore rally continue?
Despite the sharp recovery, several technical indicators suggest the rally is approaching a crucial point that could test the momentum.
On the 4-hour chart, the token has reclaimed both its 20-period exponential moving average (EMA) near $0.96 and its 50-period EMA around $1.19, indicating that short-term momentum has improved considerably.
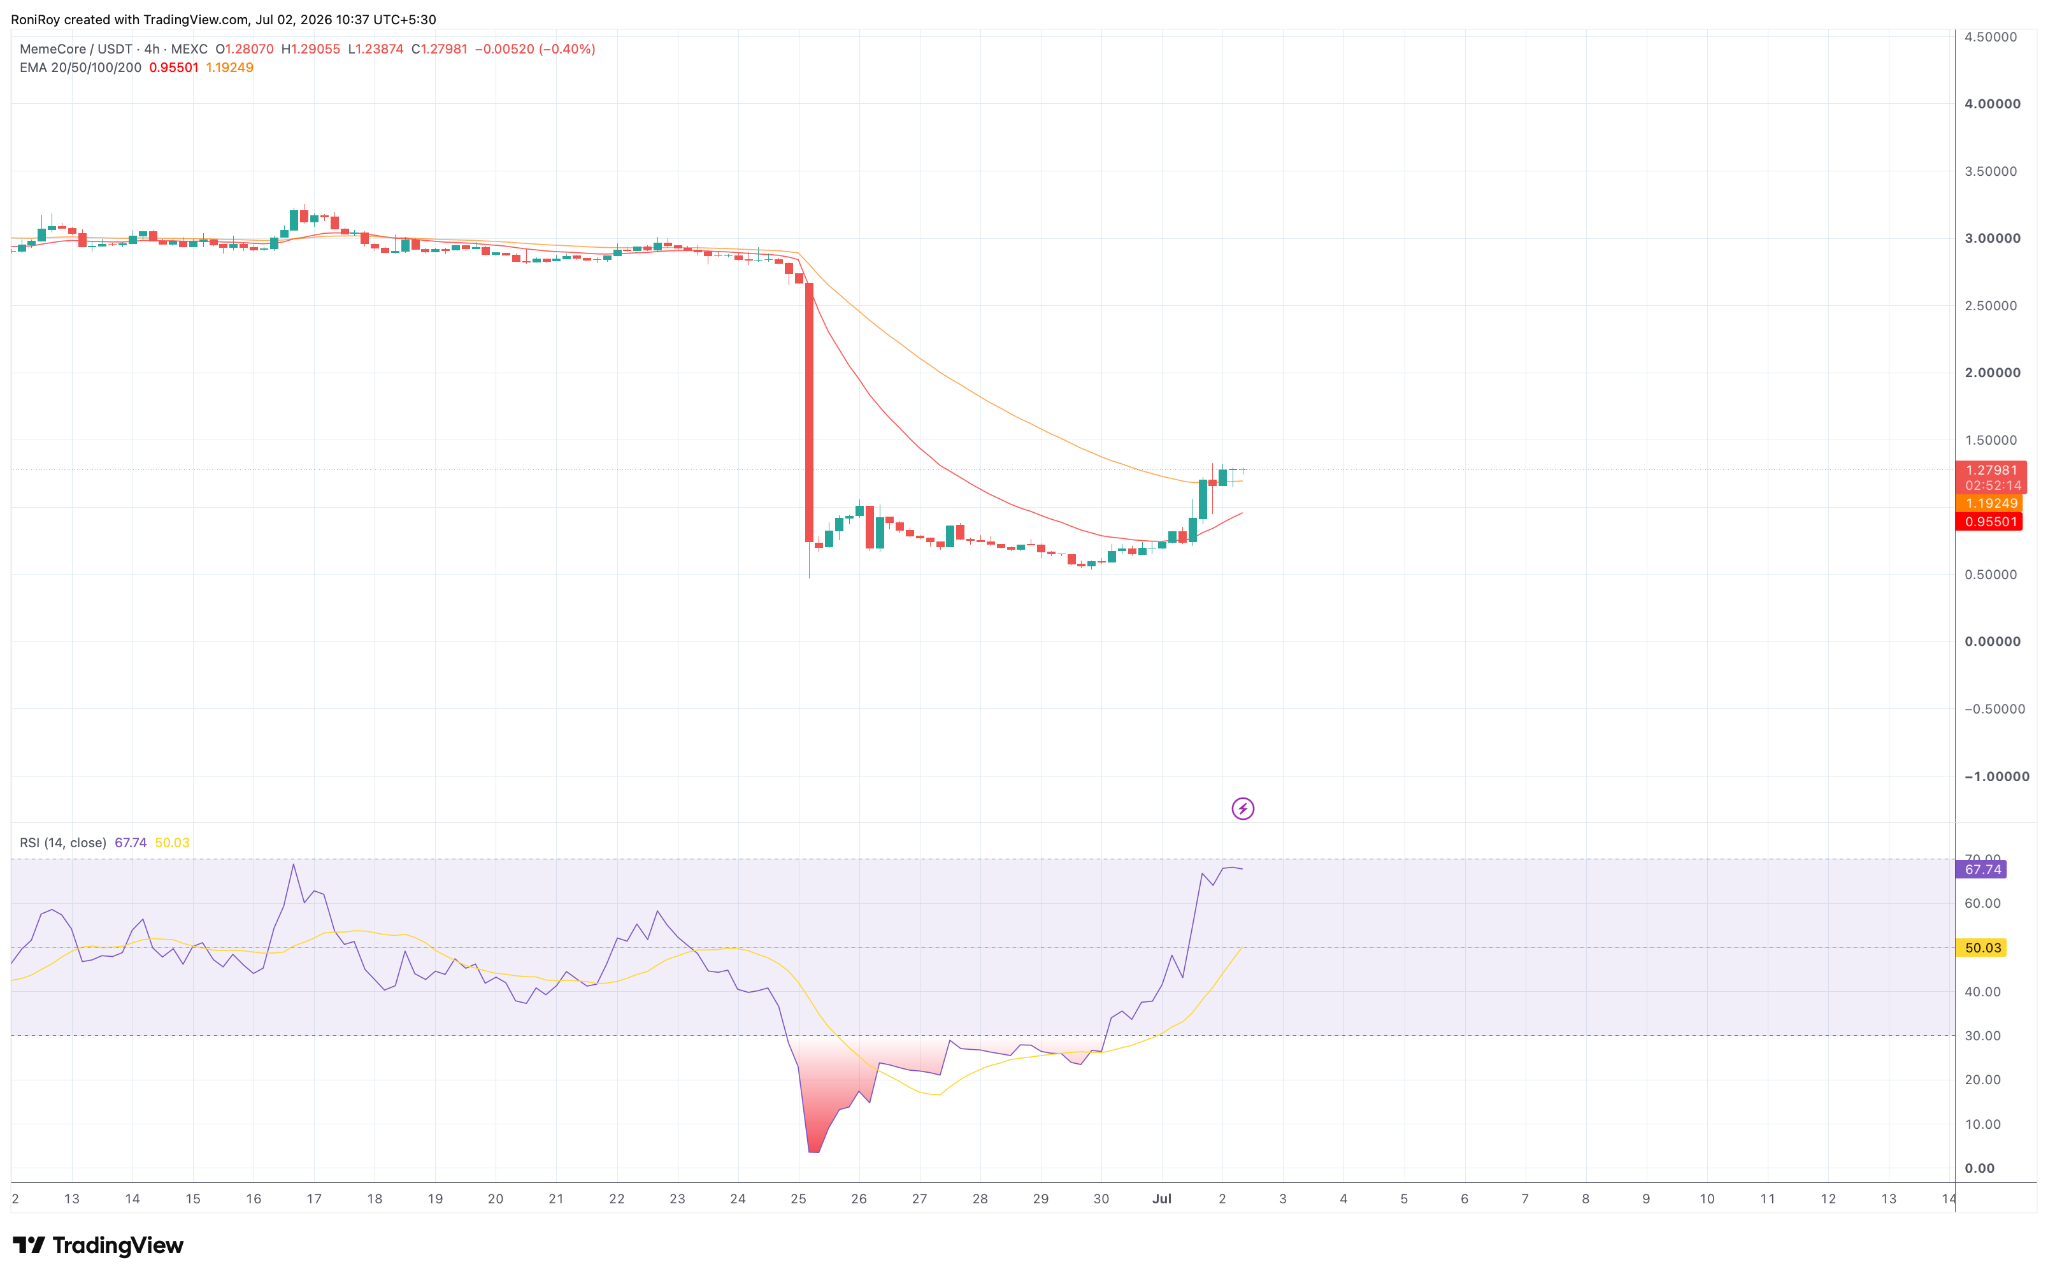
M/$USDT 4-hour price chart.
However, the 20 EMA remains below the 50 EMA, meaning a bullish moving average crossover has not yet occurred.
Until that crossover happens, the medium-term trend cannot be considered fully reversed.
Momentum indicators are also beginning to approach stretched levels.
The 4-hour Relative Strength Index (RSI) has risen to around 68, placing it just below the traditional overbought threshold of 70.
Meanwhile, the Money Flow Index (MFI) has climbed above 82, showing exceptionally strong capital inflows but also indicating that buying activity has become increasingly aggressive.
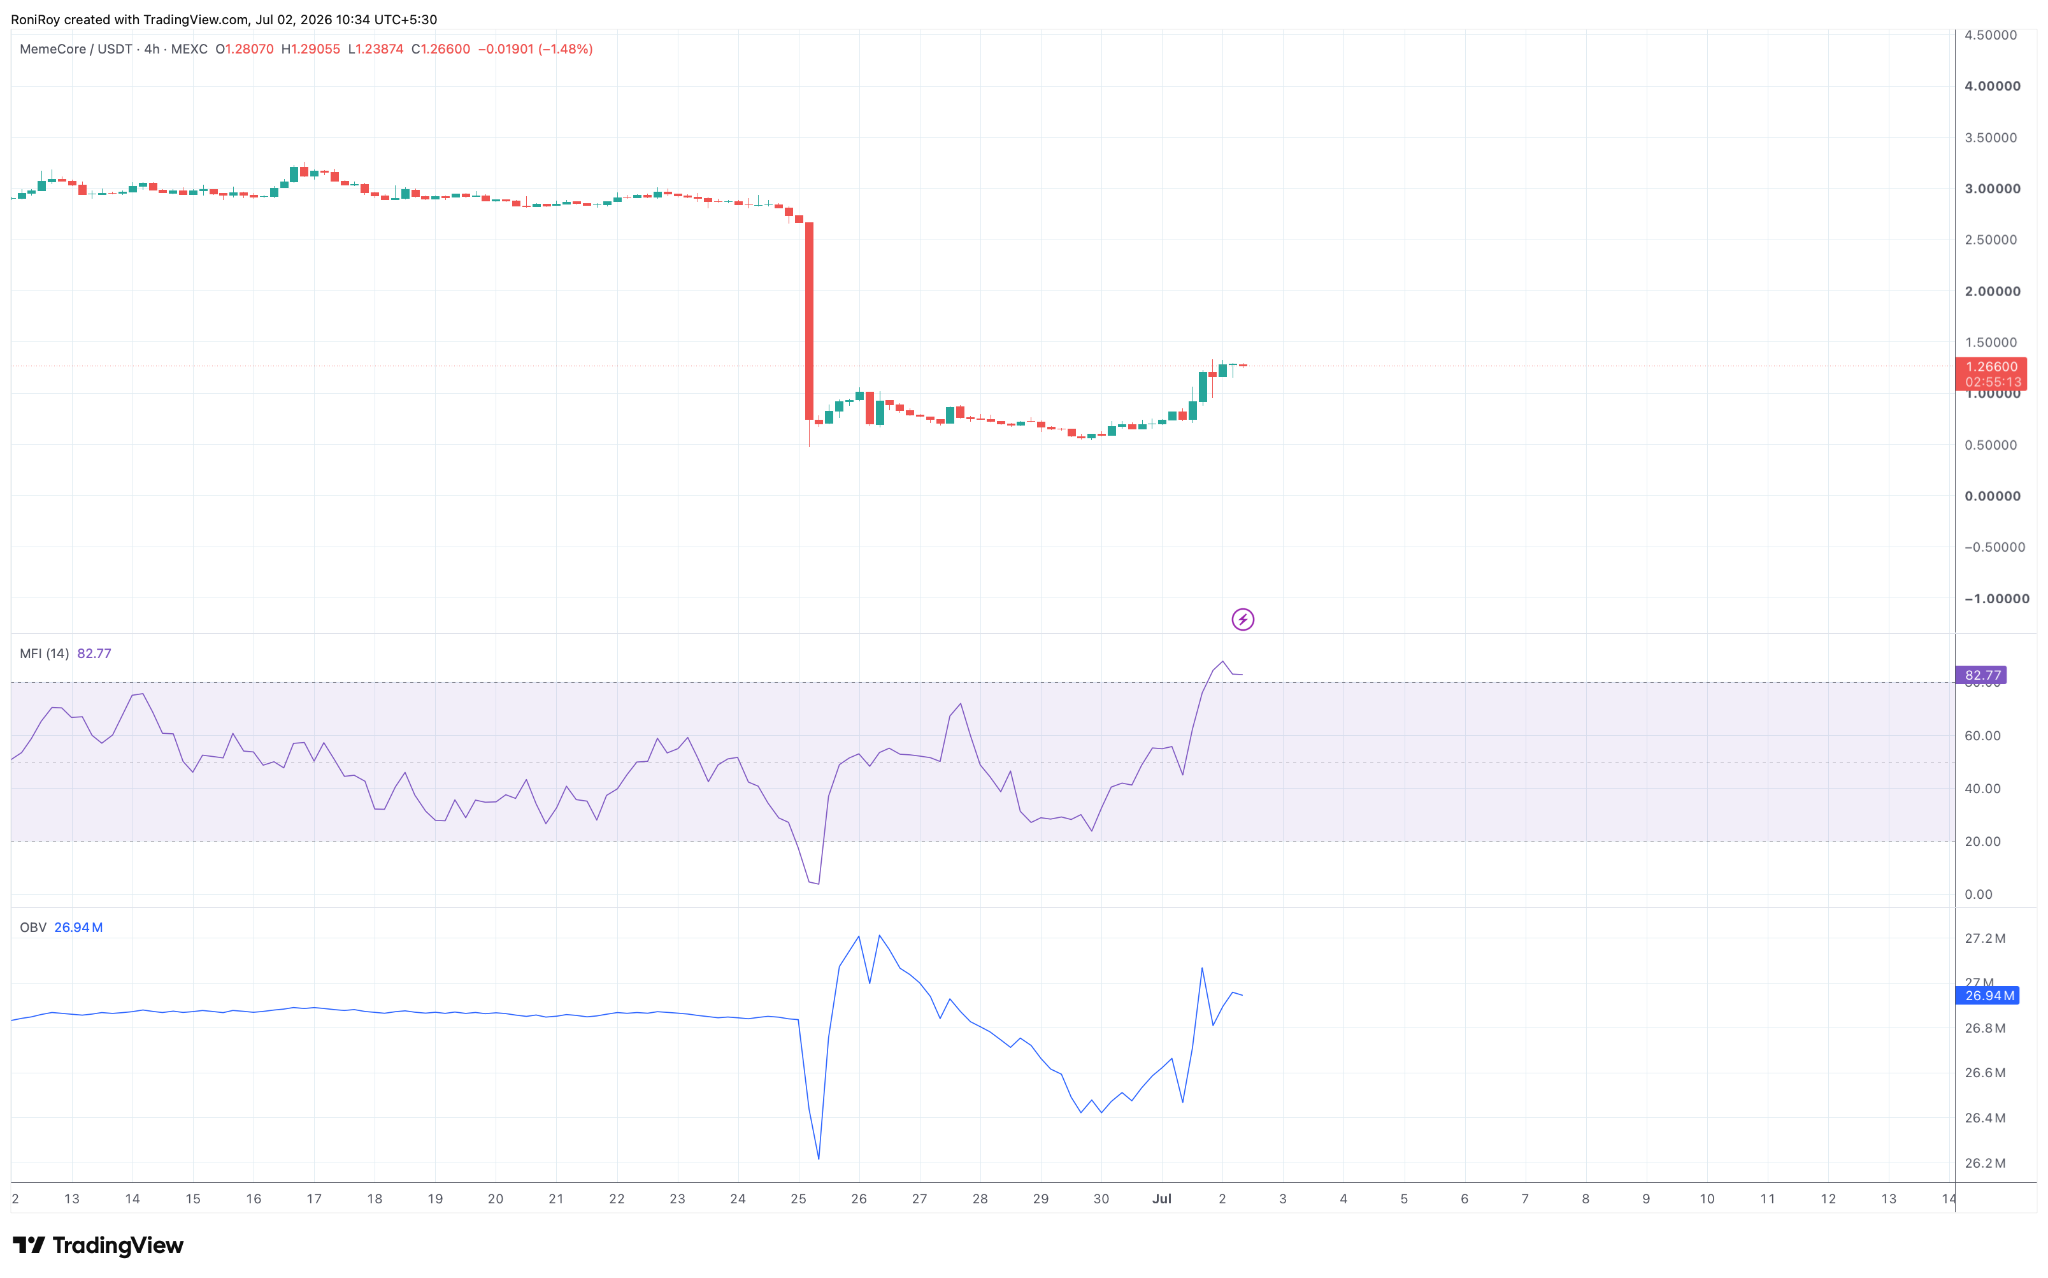
M/$USDT 4-hour price chart.
M’s On-Balance Volume (OBV) has also recovered alongside price, suggesting buyers have returned after last week's sell-off.
But OBV has yet to reclaim the levels recorded before the late-June collapse, indicating that not all of the previous distribution has been absorbed.
Price action itself points to the next areas traders are likely to monitor.
Holding above the recently reclaimed 50 EMA near $1.19 would strengthen the case for continued recovery, while maintaining support above the $1.20-$1.30 region could allow buyers to challenge higher resistance created before the June breakdown.
On the other hand, a failure to hold those levels would increase the risk of profit-taking after the rapid advance.
Fundamental risks also remain largely unchanged. ZachXBT previously alleged that wallets linked to insiders collectively control between 90% and 99% of MemeCore's token supply.
These concerns have not been resolved by the project's recent statement, leaving open the possibility that large holders could use renewed liquidity to reduce their positions.
Combined with relatively shallow order books, concentrated ownership could leave the token vulnerable to another period of sharp volatility if selling pressure returns.