
Bitget App
Trade smarter
Buy cryptoMarketsTradeFuturesStocksEarnInstitutionAI & More
Shiba Inu (SHIB) Analysis Suggests $350 Million Could Be Enough for 700% Upside Scenario

Shiba Inu (SHIB) Analysis Suggests $350 Million Could Be Enough for 700% Upside Scenario

CryptoNewsNetCryptoNewsNet2026/07/02 15:21
By:CryptoNewsNet
Back to the list

Shiba Inu (SHIB) Analysis Suggests $350 Million Could Be Enough for 700% Upside Scenario

Shiba Inu (SHIB) Analysis Suggests $350 Million Could Be Enough for 700% Upside Scenario image 0  u.today 11 m
Shiba Inu (SHIB) Analysis Suggests $350 Million Could Be Enough for 700% Upside Scenario image 1

Although Shiba Inu is still operating within a damaged market structure, the liquidity picture indicates that a relatively small amount of capital could potentially result in an outsized price reaction. The exchange reserve value of $SHIB is close to $374.3 million, and the exchange reserve is approximately 87.02 trillion tokens, according to the on-chain data provided.

Speculative cycles

In light of how aggressively $SHIB has moved during prior speculative cycles, this indicates that the liquid exchange-side supply, at least by this metric, is not very large. This is the source of the upside scenario of $350 million. $SHIB might see a significant reprice if that much concentrated demand entered the market while exchange liquidity remained scarce.
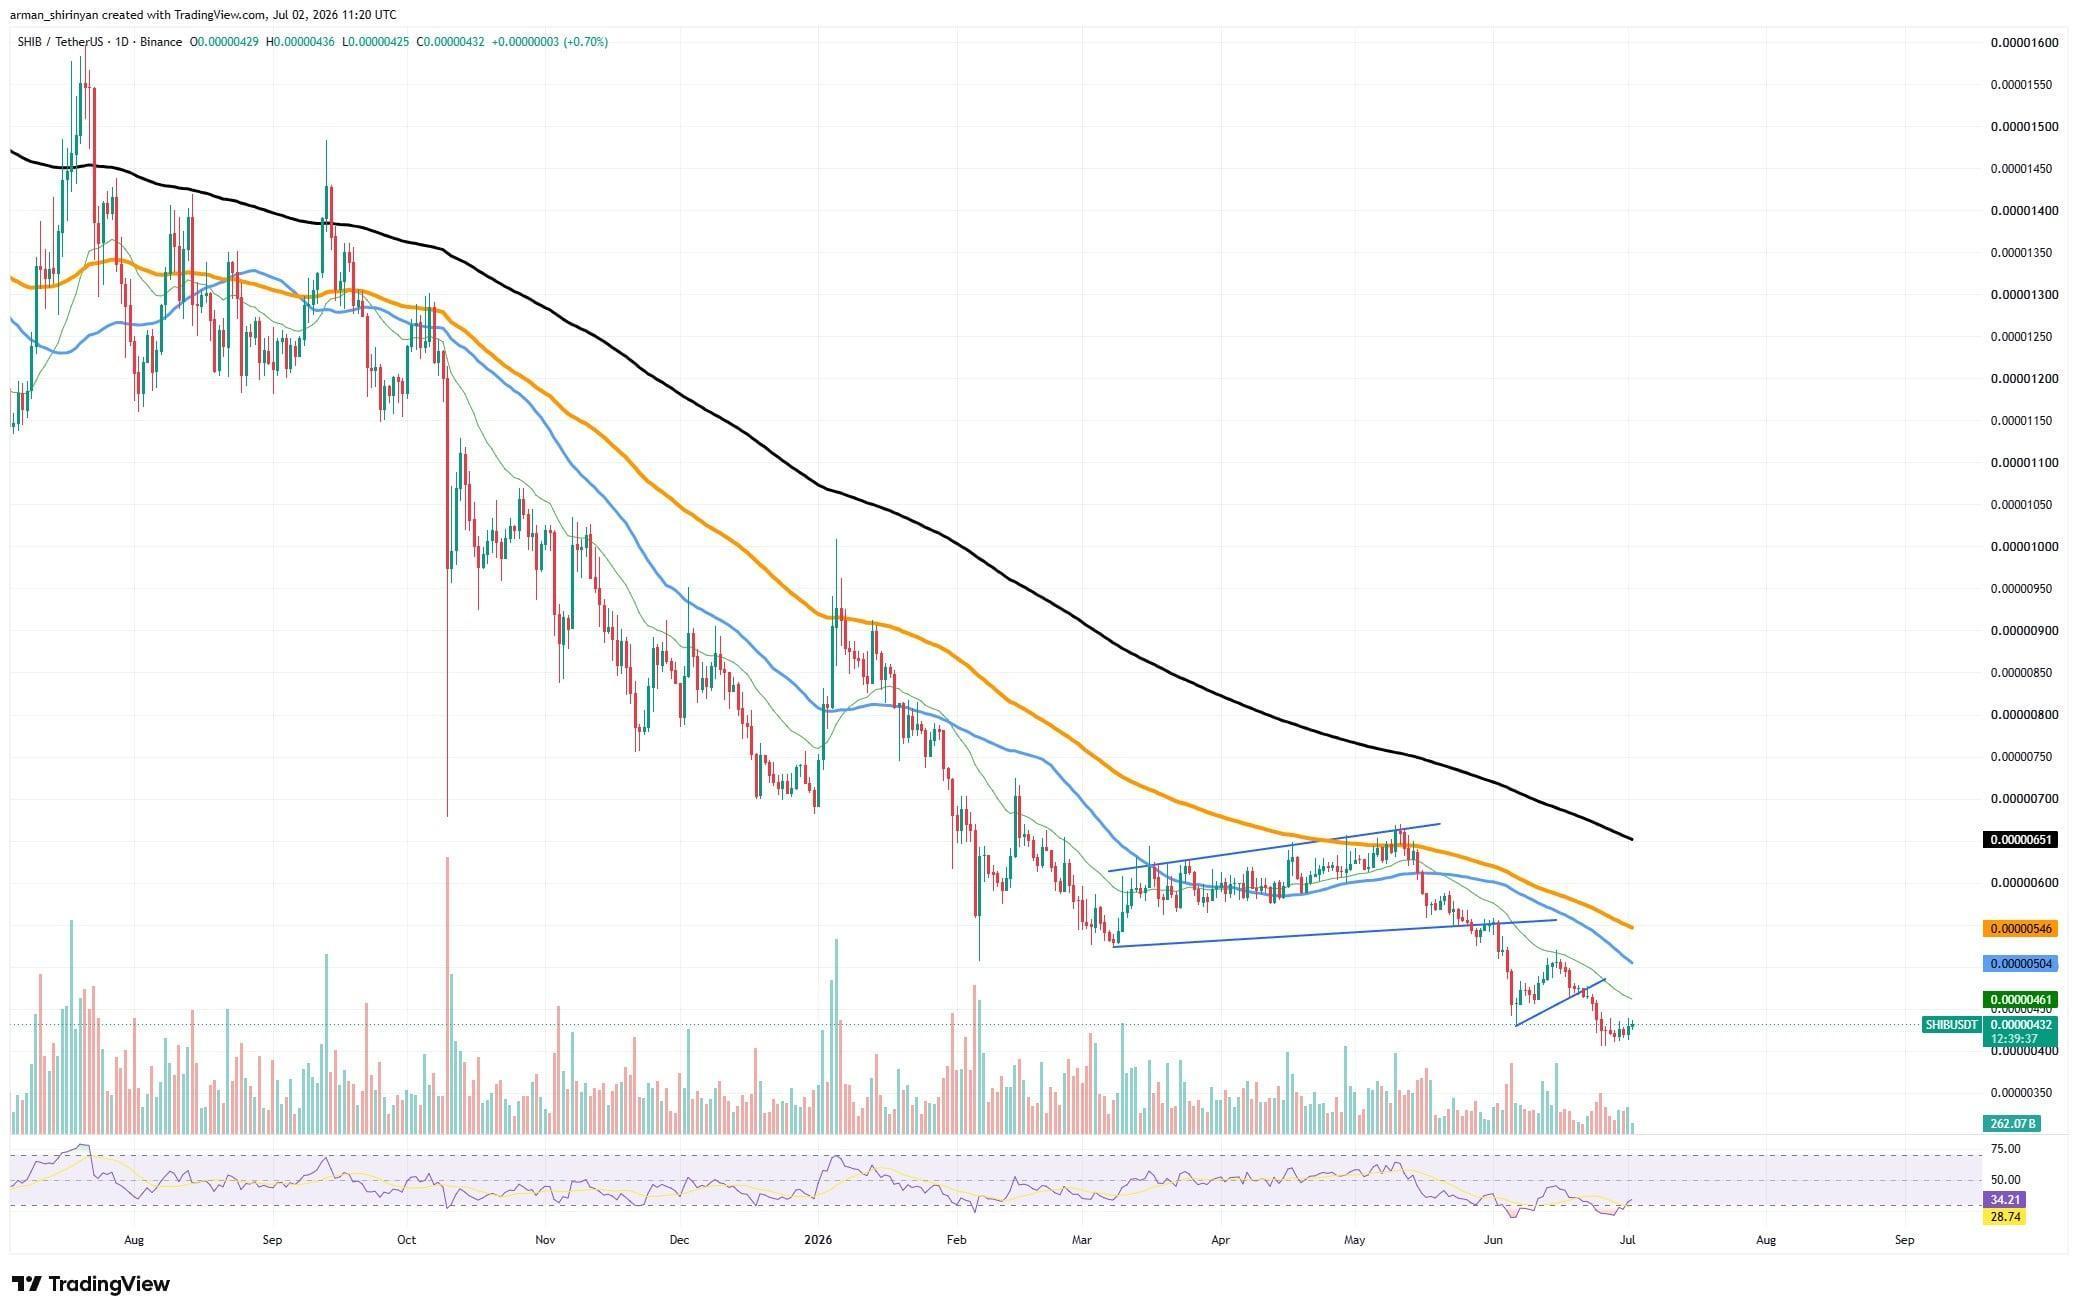
Shiba Inu (SHIB) Analysis Suggests $350 Million Could Be Enough for 700% Upside Scenario image 2 $SHIB/USDT Chart by TradingView

Because order book depth, available float, and panic/FOMO behavior are more important than raw market capitalization in meme-asset markets, prices do not always move in proportion to capital inflow. Aggressive buying can drive up prices much more quickly than conventional valuation reasoning would suggest in a thin-liquidity environment. Technically speaking, though, $SHIB has not confirmed anything approaching a complete bullish reversal.

Shiba Inu loses momentum rapidly

The token is trading close to $0.00000433 on the daily chart, which is still below the main moving averages. The larger trend is still downward, and the 50-, 100-, and 200-day averages are all still above the price. Around $0.00000505-$0.00000546, where $SHIB previously lost momentum, is the most significant resistance zone. The first real indication that bulls are taking back control would be a breakout above that region.

Near the black long-term moving average, at $0.00000651, is the larger resistance. Any rally is susceptible to rejection until $SHIB regains that level. After the June sell-off, the asset recently formed a small recovery structure, but the volume does not yet indicate a significant accumulation wave, and the bounce is still weak. On-chain activity is mixed. Both the total exchange inflow and outflow have increased by 0.41% and 0.26%, respectively.

At -0.46%, netflow is slightly negative, indicating that outflows are slightly ahead of inflows but not by enough to be considered a clear accumulation signal. Transaction counts have increased by 0.5% and active addresses by 0.61%, indicating a slight improvement in network activity rather than a spike in demand.


0
0

Disclaimer: The content of this article solely reflects the author's opinion and does not represent the platform in any capacity. This article is not intended to serve as a reference for making investment decisions.

Understand the market, then trade.
Bitget offers one-stop trading for cryptocurrencies, stocks, and gold.
Trade now!

You may also like

Wall Street giants collectively raise rate hike forecasts, US Treasury futures continue to fall, gold drops over 1% to break 4000

After the US October CPI exceeded expectations, Goldman Sachs and Nomura added a forecast for an interest rate hike in March next year, while Deutsche Bank included a forecast for a rate hike in January next year. Currently, the market has fully priced in a 25 basis point rate hike in December, with a 13% probability for a 50 basis point hike. On Wednesday, the US Treasury spot market was closed, but Treasury futures continued to fall, with corresponding yields rising by about 2 to 4 basis points, and spot gold came under pressure, dropping by 1.1%.

华尔街见闻•2026/11/11 21:18
Wall Street giants collectively raise rate hike forecasts, US Treasury futures continue to fall, gold drops over 1% to break 4000

No Need to Worry About the Cooling Down of AI Data Center Construction? The US Import Boom Is Unlikely to Subside in the Short Term, Real Impact May Come in 2029

It takes an average of 4.8 years from finalizing investment to starting construction of a data center project, and an additional 2.6 years from construction start to becoming operational. Servers usually cannot be installed until after the building structure and racks are completed. For trade partners such as Taiwan (China), South Korea, and Mexico who rely on US data center supply chain demand, the inertia in construction timelines provides at least a one- to two-year buffer for future exports.

华尔街见闻•2026/11/11 21:18
No Need to Worry About the Cooling Down of AI Data Center Construction? The US Import Boom Is Unlikely to Subside in the Short Term, Real Impact May Come in 2029

Federal Reserve Major Debate: When Should the Tenure of “Number Three” Williams End?

The main point of contention is whether Williams should step down in June 2028, upon completing a full 10-year term, or in June 2027, when he reaches the mandatory retirement age of 65. Analysts point out that the Federal Reserve Board holds ultimate discretion; if he leaves early, Fed Chair Waller would be able to assert greater control over the appointment to this critical position. However, forcing Williams to shorten his term could easily be interpreted as political manipulation. Williams himself is expected to serve until June 2028.

华尔街见闻•2026/11/11 21:18
Federal Reserve Major Debate: When Should the Tenure of “Number Three” Williams End?

