- Bitcoin’s recent six-month correction mirrors previous downturns that eventually preceded explosive market recoveries.
- Historical charts suggest periods of maximum fear often emerge shortly before major cryptocurrency expansions begin.
- Expectations for Bitcoin and altcoins remain elevated as traders compare current conditions with past cycles.
Bitcoin Recovery is once again dominating market discussions as traders compare the recent correction with historical periods that eventually produced some of cryptocurrency’s strongest rallies.
Historical Charts Point to Familiar Market Pattern
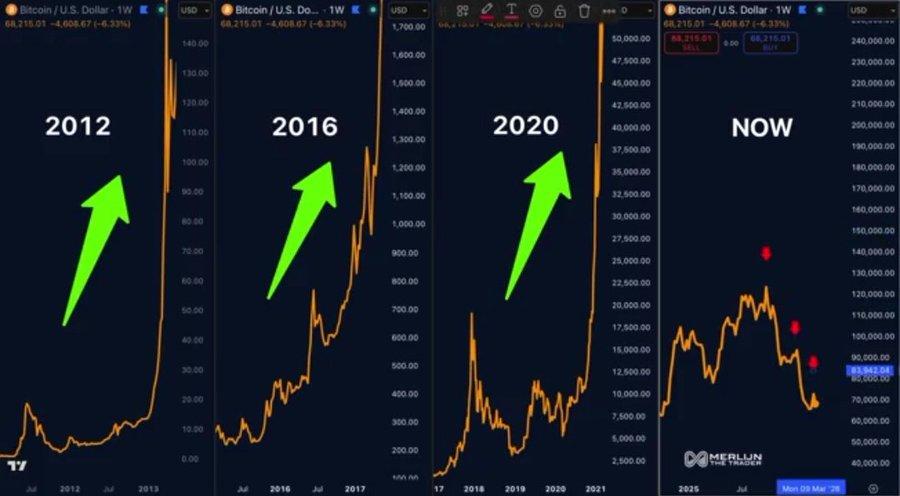
MrBigDott made a post on social media that showed the current structure of Bitcoin and how it resembles 2012, 2016, and 2020. The study was based on the premise that “big changes tend to come before big growths.”
 Source:
The chart showed green arrows at historical turning points. During those times there was a lot of doom and gloom and not that much investor confidence.
In every cycle, Bitcoin saw extended periods of consolidation which were followed by significant gains.
During each cycle, Bitcoin experienced prolonged consolidations before powerful advances. The recurring pattern has become a central part of long-term bullish arguments.
The post described the last six months as worse than the COVID crash. Despite that assessment, the message maintained a strongly optimistic outlook.
Previous Corrections Eventually Produced Major Advances
The 2012 cycle showed Bitcoin trading sideways after a severe retracement. Market sentiment remained weak before prices accelerated higher.
A similar structure emerged during the 2016 recovery period. Bitcoin gradually strengthened while many participants remained skeptical.
The 2020 COVID crash provided another notable example of extreme fear. That collapse later became the foundation for Bitcoin’s move toward record highs.
The comparison suggests that difficult market conditions do not always signal prolonged weakness. Historical corrections have frequently occurred before major uptrends emerged.
Current Structure Keeps Investors Focused on Long-Term Potential
The current chart differs from previous examples through repeated rejection points. Several failed rallies have reinforced caution across the market.
Bitcoin looks like it is forming support around the $70,000-$80,000 price range. This has emerged as a strong conflict of interest between buyer and seller.
The social media post projected that Bitcoin could eventually rise two to three times. It also suggested substantially larger gains for alternative cryptocurrencies.
The broader message focused on market psychology rather than short-term price action. According to the historical comparison, periods of extreme pessimism have often preceded significant advances.
Whether the current market follows previous templates remains uncertain. However, the chart argues that today’s weakness resembles conditions seen before earlier cryptocurrency expansions.
As a result, long-term investors continue monitoring the developing structure closely. The debate now centers on whether another accumulation phase is nearing completion.