
A Chart of Commodity Support and Resistance: Gold, Silver, Oil, Gas + Platinum, Palladium, Copper, Agricultural Futures (June 30, 2026)

FX678 June 30—— A single chart visualizing commodity support and resistance: gold, silver, oil, gas, platinum, palladium, copper, and agricultural futures, updated on Tuesday, June 30, 2026, 07:00 (UTC+8). Specifically covering 14 varieties including gold, silver, platinum, palladium, copper, crude oil, natural gas, fuel oil, wheat, corn, and cotton. For more details, refer to the FX678's custom chart.
A chart visualizing commodity support and resistance: gold, silver, oil, gas, platinum, palladium, copper, and agricultural futures, updated on Tuesday, June 30, 2026, 07:00 (UTC+8). Specifically covering 14 varieties including gold, silver, platinum, palladium, copper, crude oil, natural gas, fuel oil, wheat, corn, and cotton. For more details, see the content in the specially-made FX678 chart.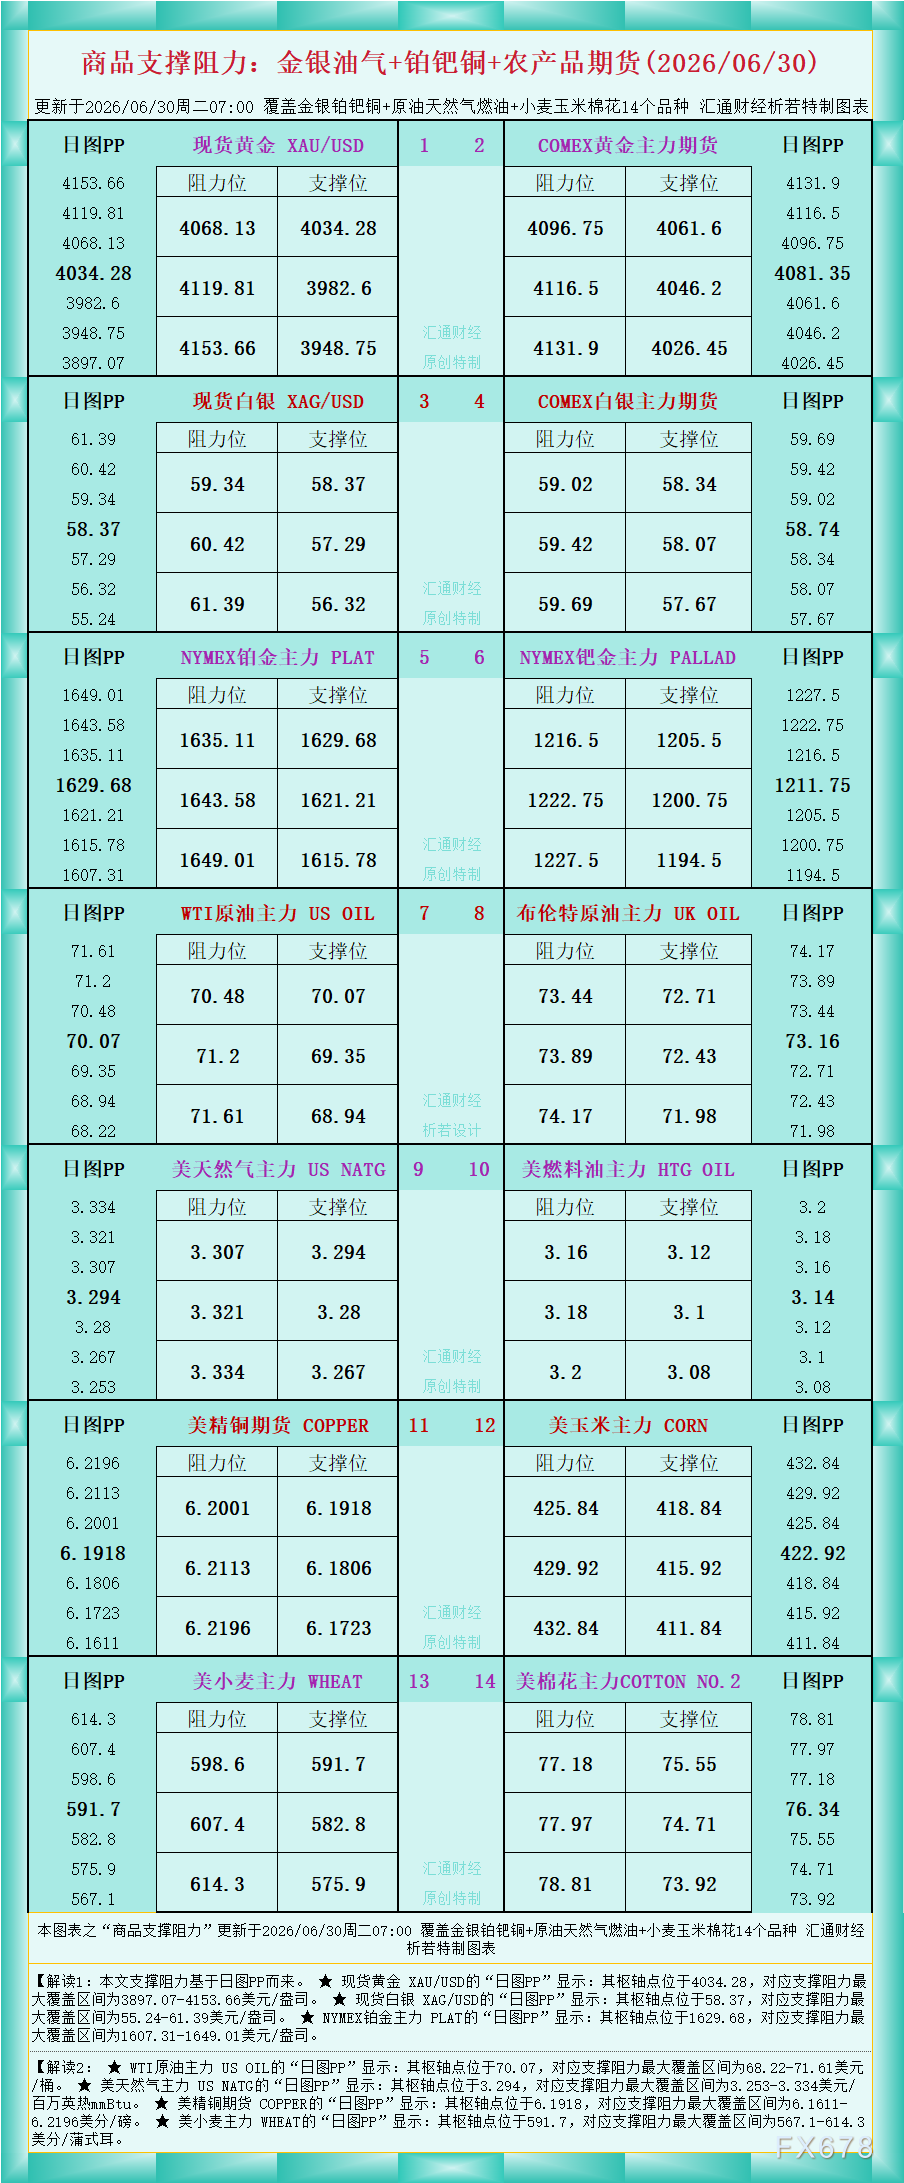
As shown in the figure, Interpretation 1: The support and resistance levels in this article are based on the daily chart pivot points (PP).
★ For spot gold XAU/USD, the “Daily Chart PP” shows: the pivot point is at 4034.28, with the maximum support and resistance range covering $3897.07-$4153.66/oz.
★ For spot silver XAG/USD, the “Daily Chart PP” shows: the pivot point is at 58.37, with the maximum support and resistance range covering $55.24-$61.39/oz.
★ For NYMEX platinum main contract PLAT, the “Daily Chart PP” shows: the pivot point is at 1629.68, with the maximum support and resistance range covering $1607.31-$1649.01/oz.
Interpretation 2:
★ For WTI Crude Oil main contract US OIL, the “Daily Chart PP” shows: the pivot point is at 70.07, with the maximum support and resistance range covering $68.22-$71.61/barrel.
★ For US natural gas main contract US NATG, the “Daily Chart PP” shows: the pivot point is at 3.294, with the maximum support and resistance range covering $3.253-$3.334/MMBtu.
★ For US copper futures COPPER, the “Daily Chart PP” shows: the pivot point is at 6.1918, with the maximum support and resistance range covering 6.1611-6.2196 cents/pound.
★ For US wheat main contract WHEAT, the “Daily Chart PP” shows: the pivot point is at 591.7, with the maximum support and resistance range covering 567.1-614.3 cents/bushel.
For more variety interpretations, refer to the chart. Produced originally and exclusively by FX678. All rights reserved.
Disclaimer: The content of this article solely reflects the author's opinion and does not represent the platform in any capacity. This article is not intended to serve as a reference for making investment decisions.
You may also like
AI Trading "Weather Vane": Meta's Bond Issuance Faces Multiple Twists and Turns
Meta's $46 billion Election Day bond issuance faced multiple challenges: a credit rating downgrade by S&P, Microsoft gaining market share, and political upheaval. The CFO personally presented to 500 investors, ultimately paying a real financial cost—the spread on the longest-term bonds widened by 90 basis points compared to April. The Democratic "blue wave" has sharply increased regulatory risks for AI data centers, tech bond spreads continued to widen last week, and whether AI capital expenditures can translate into returns remains the biggest question for the market.

CICC: Accelerated Employment Expansion, Fed Maintains Gradual Rate Hikes
China International Capital Corporation (CICC) released a research report stating that the baseline scenario remains that the Federal Reserve will raise interest rates once more in December and then shift to a wait-and-see approach.

Riot Sells More Than 20,000 Bitcoin as AI Data-Centre Contracts Reach $38B
Crypto prices
More


