
One Chart: Overview of Gold, Crude Oil, Forex, and Stock Index "Pivot Points + Long/Short Position Signals" on June 23, 2026

Huitong Finance, June 23—— Below is the latest "Pivot Points + Long/Short Positioning Signals" overview for gold, crude oil, forex, and stock indices from the "One Chart Series," including graphic and text interpretations. By comparing the latest net long % with the previous net long % (net long % from the previous trading day), the interpreted position signals cover a total of 13 types: net long expansion, net long reduction, no change in net short, net short turning balanced, etc. According to the actual data comparison results, a few of these signals are displayed accordingly.
One Chart: "Pivot Points + Long/Short Positioning Signals" Overview for Gold, Crude Oil, Forex, and Stock Indices on June 23, 2026. Today's (Tuesday, June 23, 2026) latest data show that as of just now, in this chart, there are 2 products currently in the "overbought" state (longs above 80%), and 2 products in the "oversold" state (longs below 20%). Among them, the product with the highest proportion of long positions is: NZD/USD. XAU/USD long position ratio: 74%, WTI OIL long position ratio: 78%, EUR/USD long position ratio: 75%. For more details on the "change signals" compared with yesterday and a more detailed list, see specifically designed Huitong Finance charts.
Among the position change signals, net long expanded in 7 products, net long decreased in 3 products, net short expanded in 6 products, net short decreased in 2 products, and net long turned balanced in 1 product. The products with positions at or above 80% are S&P 500 Index with a long ratio of 82%. USD/JPY short position ratio as high as 93%. USD/CAD short position ratio as high as 88%. NZD/USD long position ratio as high as 87%.
[Chart: Interpretation of Pivot Points and Long/Short Positioning Signals for Gold, Crude Oil, Forex, and Stock Indices, Source: Special Chart by Huitong Finance. (Click the image to view larger)]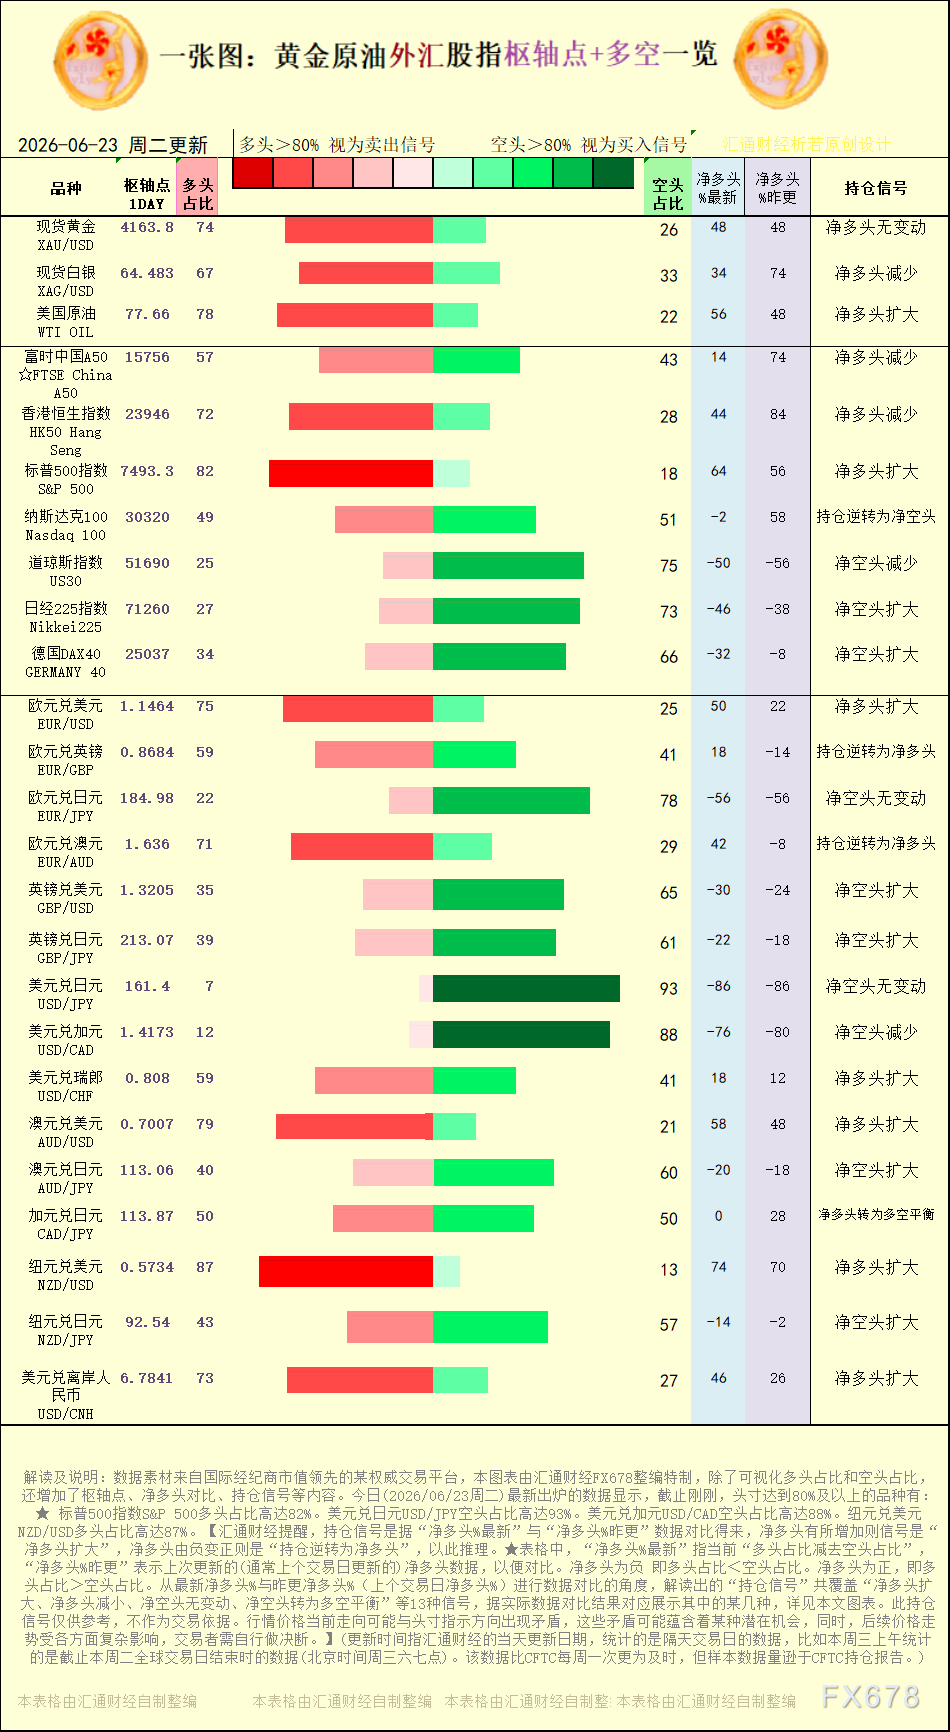
Net short decreased in: US30 (Dow Jones Industrial Average), USD/CAD.
Net long expanded in: WTI OIL, S&P 500 Index, EUR/USD, USD/CHF, AUD/USD, NZD/USD, USD/CNH. Net long decreased in: XAG/USD, FTSE China A50, HK50 Hang Seng.
Huitong Finance reminds you that positioning signals are derived from the comparison between "Latest Net Long %" and "Previous Net Long %." If net long increases, the signal is "net long expansion"; if net long turns from negative to positive, it's positioned as "position reversal to net long," and so on. ★In the table, "Latest Net Long %" refers to the current "long position ratio minus short position ratio," while "Previous Net Long %" is the last updated (usually the previous trading day) net long data for comparison. Negative net long means long position ratio < short position ratio; positive net long means long position ratio > short position ratio. The interpreted "positioning signals" derived from the comparison between latest net long % and previous net long % (the previous trading day's net long %) cover 13 signals, including "net long expansion, net long reduction, no change in net short, net short turning balanced," and several of these are shown according to actual data. The current market price trend may sometimes contradict the indicated position direction, and such contradictions may imply potential opportunities. However, the subsequent price trend is affected by complex factors, so traders need to make their own decisions.
[Trading products involved in this chart: spot gold, spot silver, WTI OIL, FTSE China A50, HK50 Hang Seng, S&P 500 Index, NASDAQ 100, Dow Jones Industrial Average, Germany DAX40, EUR/USD, EUR/GBP, EUR/JPY, EUR/AUD, GBP/USD, GBP/JPY, USD/JPY, USD/CAD, USD/CHF, AUD/USD, AUD/JPY, CAD/JPY, NZD/USD.]
Disclaimer: The content of this article solely reflects the author's opinion and does not represent the platform in any capacity. This article is not intended to serve as a reference for making investment decisions.
You may also like
The AI boom may follow the path of the 19th-century railway bubble, and builders may not be the ultimate winners
Goldman Sachs analyst Bobby Molavi compared the current situation to the 19th-century British railway mania: 500 companies spent more than the nation's annual income building 8,000 miles of railway, with most early investors losing out, while the real beneficiaries were the later "passengers." He pointed out that the current AI craze is driven by both debt and momentum, and that the S&P 500’s forward P/E ratio of 18x is only "a bit cheaper." Whether the builders can retain value is uncertain, and history does not offer an optimistic answer.

If Anthropic's IPO goes smoothly and the stock price rises next week, then everything remains the same for AI. Otherwise, some companies will go bankrupt.
The shrinking valuations of two major giants have triggered a chain reaction—investors are adopting more conservative revenue multiples for AI startups and are directly halting high-valuation financing for companies with zero revenue. Multiple venture capital firms have advised their portfolio companies to lower valuation expectations and to quickly build up cash reserves. Market participants warn that the outcome of Anthropic’s IPO will be a barometer for the industry: if successful, the boom will continue; if it fails, some companies may face elimination.
After the Brazilian election, political discount deepens; Morgan Stanley remains bullish on Petrobras (PBR.US), focusing on fuel pricing and dividends
Morgan Stanley still maintains its most optimistic "Overweight" rating, but has lowered its year-end 2027 target price from $31 to $25.

Corning (GLW.US) receives initial "Buy" rating from Jefferies! AI factories driving a fiber optic rush, with a potential global supply gap of up to 30%
For Corning, the recent profit growth mainly comes from the expansion of AI clusters. As the number of optical links crossing cabinets and campuses increases, customers need to deploy more optical fibers within limited conduit and cabinet space, thus driving demand for high-density optical cables and connection systems.
Crypto prices
More


