
Bitcoin metric near ‘low-risk’ zone after holders absorb 125K BTC in June: Time for a rebound?

Bitcoin’s (BTC) risk-adjusted return profile is approaching levels historically aligned with long-term accumulation zones. The Sharpe ratio, a metric that measures return relative to volatility, dropped to -20, a threshold that marked major Bitcoin bottoms in every bear market since 2015.
At the same time, BTC exchange reserves have fallen by roughly 80,000 BTC since February, while demand from accumulator addresses more than doubled to 240,000 BTC from 115,000 BTC during the first two weeks of June.
BTC's Sharpe ratio revisits a historical bottom zone
Bitcoin’s Sharpe ratio reached -20 on June 11, a level that coincided with major cycle lows over the past decade. The metric first dropped below the threshold on Jan. 5, 2015, and remained there until June 12, when BTC established a durable bottom and entered a recovery phase.
A similar pattern emerged between Dec. 8, 2018, and March 7, 2019, when the Sharpe ratio spent most of the three months below -20 during Bitcoin’s bear market floor. The metric repeated the signal from Oct. 7, 2022, through January 7, 2023, shortly before BTC began its next sustained bullish period.

Bitcoin Sharpe ratio. Source: CryptoQuant
While no single metric identifies market bottoms with precision, periods below -20 have typically coincided with extended accumulation phases for BTC.
Onchain data points in the same direction. Bitcoin held on exchanges has declined to 2.71 million on Monday from 2.79 million BTC in February. BTC exchange reserves briefly rebounded to 2.73 million BTC from a yearly low of 2.65 million BTC between late April and early June, though balances have since fallen by about 12,000 BTC over the past two weeks.
Demand from accumulator addresses has strengthened during the same period. The cohort absorbed 125,000 BTC between June 1 and June 14. This indicates growing interest among wallets that have a history of holding rather than distributing coins.
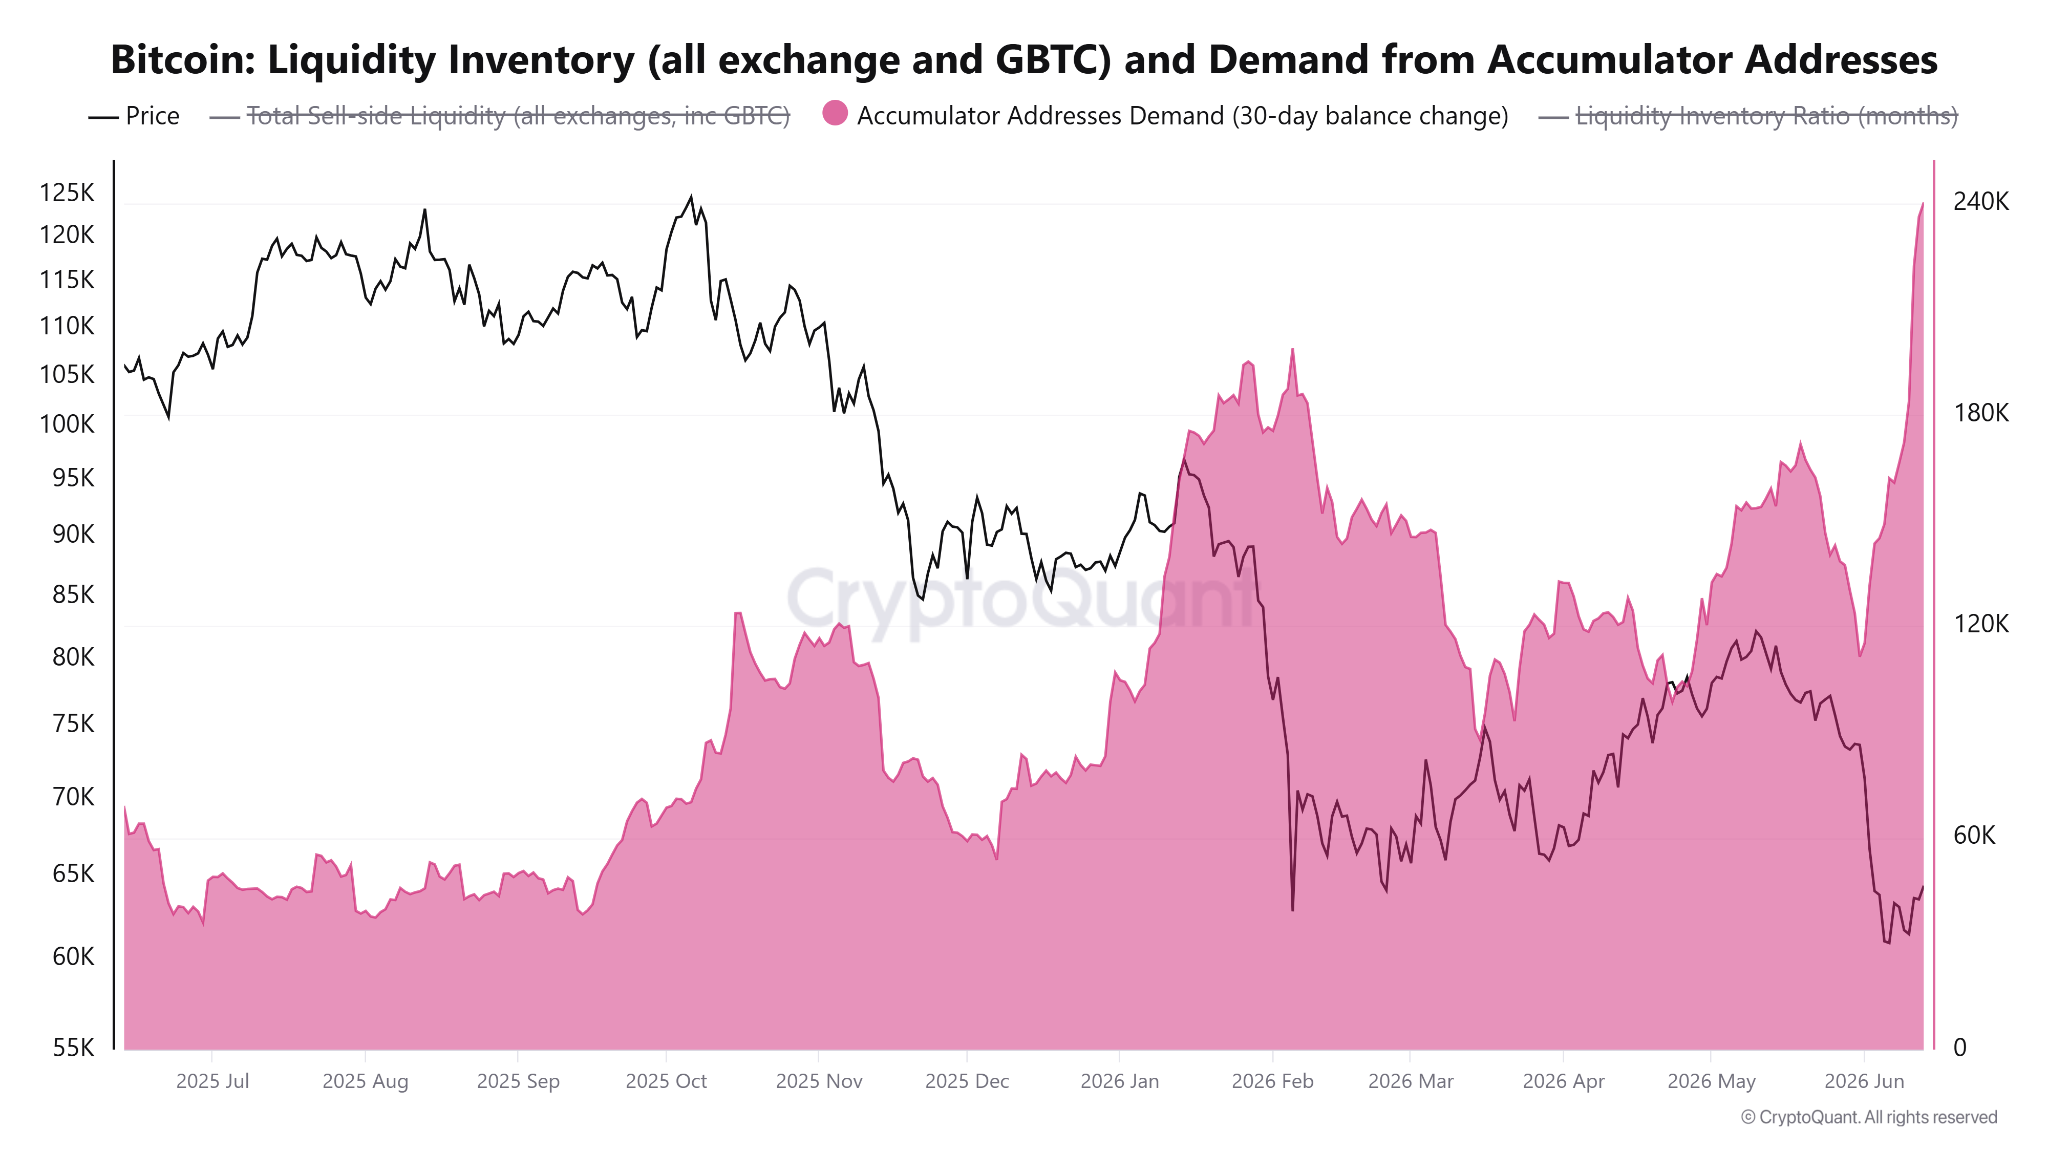
BTC demand from accumulator addresses. Source: CryptoQuant
Bitcoin’s consolidation below the key weekly trendline is still developing
Bitcoin has spent 133 consecutive days below its 100-week simple moving average (SMA), a long-term trend indicator currently located near $88,466.
Market cycle data show that Bitcoin often trades below the 100-week SMA for extended periods before reclaiming it. Following the 2013 market peak, BTC spent 378 days below the trendline while consolidating between $200 and $400. During the 2018-2019 bear market, BTC remained below the 100-week SMA for 175 days and traded between $3,000 and $6,000.

BTC price, and 100-period weekly SMA trend analysis. Source: Cointelegraph/TradingView
The longest stretch occurred after the 2022 market decline. Bitcoin remained below the 100-week SMA for 532 days while trading between $16,000 and $25,000.
Across those three cycles, Bitcoin spent an average of roughly 362 days under the indicator before reclaiming it and establishing a sustained uptrend. Each period was characterized by prolonged accumulation rather than an immediate recovery.
With 133 days already logged below the 100-week SMA, the current cycle is still well below the historical average. Previous examples indicate that consolidation phases beneath the trendline often persist for several more months before Bitcoin reclaims the level.
Disclaimer: The content of this article solely reflects the author's opinion and does not represent the platform in any capacity. This article is not intended to serve as a reference for making investment decisions.
You may also like
The AI boom may follow the path of the 19th-century railway bubble, and builders may not be the ultimate winners
Goldman Sachs analyst Bobby Molavi compared the current situation to the 19th-century British railway mania: 500 companies spent more than the nation's annual income building 8,000 miles of railway, with most early investors losing out, while the real beneficiaries were the later "passengers." He pointed out that the current AI craze is driven by both debt and momentum, and that the S&P 500’s forward P/E ratio of 18x is only "a bit cheaper." Whether the builders can retain value is uncertain, and history does not offer an optimistic answer.

If Anthropic's IPO goes smoothly and the stock price rises next week, then everything remains the same for AI. Otherwise, some companies will go bankrupt.
The shrinking valuations of two major giants have triggered a chain reaction—investors are adopting more conservative revenue multiples for AI startups and are directly halting high-valuation financing for companies with zero revenue. Multiple venture capital firms have advised their portfolio companies to lower valuation expectations and to quickly build up cash reserves. Market participants warn that the outcome of Anthropic’s IPO will be a barometer for the industry: if successful, the boom will continue; if it fails, some companies may face elimination.
After the Brazilian election, political discount deepens; Morgan Stanley remains bullish on Petrobras (PBR.US), focusing on fuel pricing and dividends
Morgan Stanley still maintains its most optimistic "Overweight" rating, but has lowered its year-end 2027 target price from $31 to $25.
Corning (GLW.US) receives initial "Buy" rating from Jefferies! AI factories driving a fiber optic rush, with a potential global supply gap of up to 30%
For Corning, the recent profit growth mainly comes from the expansion of AI clusters. As the number of optical links crossing cabinets and campuses increases, customers need to deploy more optical fibers within limited conduit and cabinet space, thus driving demand for high-density optical cables and connection systems.

Crypto prices
More


