
Bitget App
Trade smarter
Buy cryptoMarketsTradeFuturesStocksEarnInstitutionAI & More
S&P 500 flashing possible death cross; What next?

S&P 500 flashing possible death cross; What next?

CryptoNewsNetCryptoNewsNet2026/06/16 18:48
By:CryptoNewsNet
Back to the list

S&P 500 flashing possible death cross; What next?

S&P 500 flashing possible death cross; What next? image 0  finbold.com 26 m
S&P 500 flashing possible death cross; What next? image 1

The S&P 500 could be approaching a key technical inflection point after an analyst identified the potential formation of a four-hour death cross, a bearish signal that last appeared in February 2026 before triggering a notable pullback.

According to TradingShot’s analysis shared in a TradingView post on June 16, the current market structure closely resembles the bearish megaphone pattern that developed ahead of the February decline.

At the time, the four-hour death cross occurred while the index was testing the upper boundary of the pattern, marked by a series of lower highs. The same setup appears to be forming again. As of press time, the benchmark was trading at 7,554, up 1.6%.
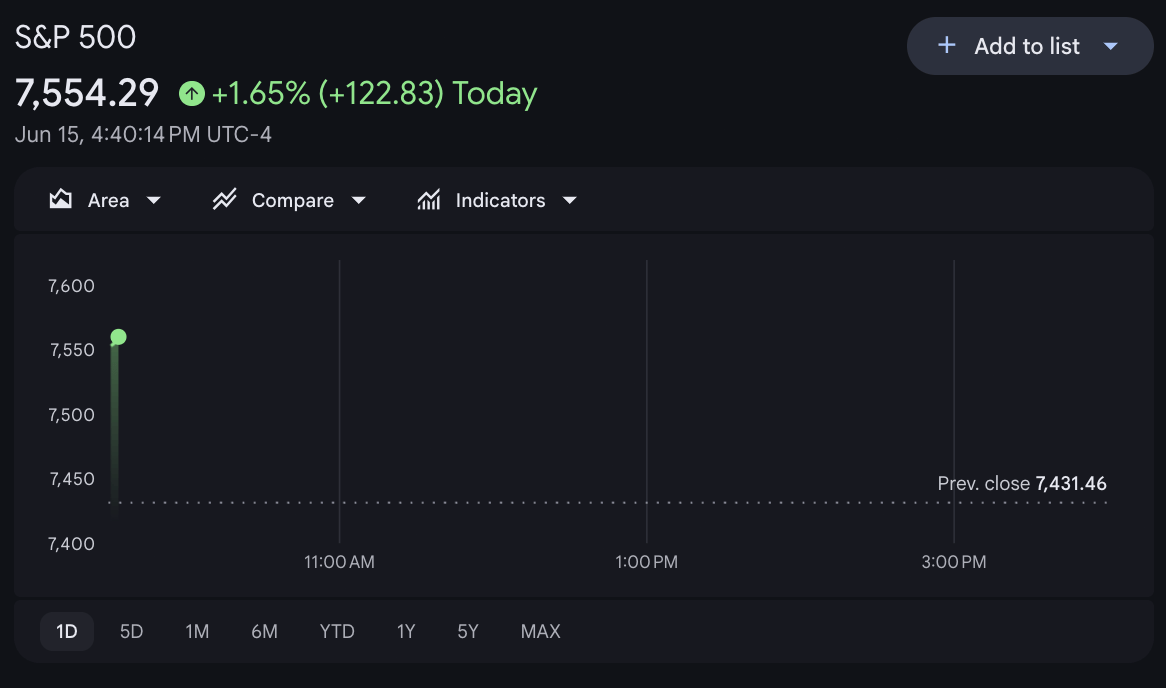
S&P 500 flashing possible death cross; What next? image 2 S&P 500 one-day chart. Source: Google Finance

TradingShot’s analysis shows the S&P 500 trading near the upper boundary of a bearish megaphone pattern while facing resistance from a series of lower highs.

A potential crossover of the four-hour 50-period moving average below the 200-period moving average would form a death cross, a signal that preceded a fresh bearish leg when it last appeared on February 12.
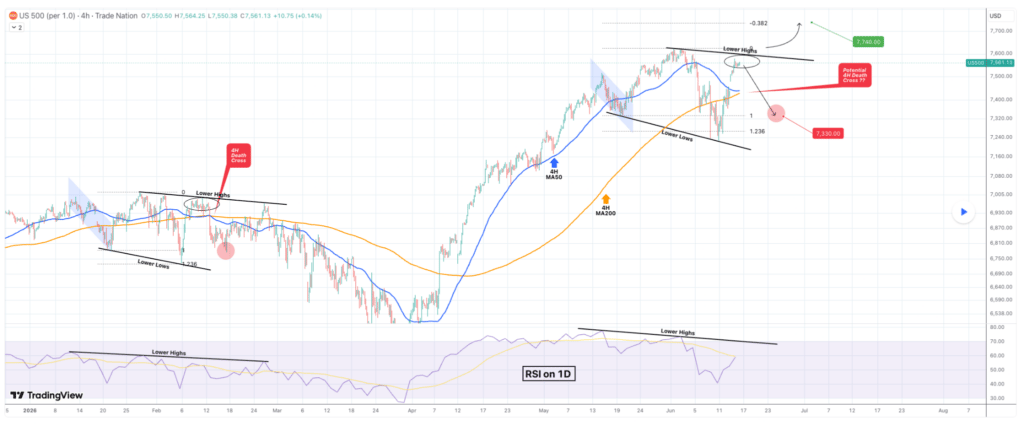
S&P 500 flashing possible death cross; What next? image 3 S&P 500 analysis chart. Source: TradingView

The setup is further supported by the one-day RSI, which is forming lower highs similar to those seen before the February decline.

Based on this historical fractal, TradingShot suggests a confirmed death cross could send the S&P 500 toward 7,330, the current 1.0 Fibonacci level and roughly 3% below current prices.

However, the bearish outlook depends on the death cross materializing and the index failing to break above its previous all-time high. TradingShot also highlighted a bullish alternative if resistance is cleared.

S&P 500 next target

If the S&P 500 breaks above its all-time high, represented by the 0.0 Fibonacci level on the chart, the broader uptrend could resume. In that scenario, the analyst sees an initial upside target at 7,740, corresponding to the -0.382 Fibonacci extension.

The bullish case is supported by strong market fundamentals. Recent earnings estimates point to robust profit growth across the index, while improving market breadth has seen sectors beyond large-cap technology participate in the rally.

Although the outlook highlights a potential short-term bearish signal, the longer-term trend remains positive.

The index is up more than 10% year-to-date and approximately 25% over the past year, supported by strong corporate earnings and continued investor demand for equities.

Wall Street’s year-end targets generally remain above current levels, with forecasts largely ranging between 7,700 and 8,100.


0
0

Disclaimer: The content of this article solely reflects the author's opinion and does not represent the platform in any capacity. This article is not intended to serve as a reference for making investment decisions.

Understand the market, then trade.
Bitget offers one-stop trading for cryptocurrencies, stocks, and gold.
Trade now!

You may also like

Just bet on AI and already faced a market blow! Berkshire reports earnings tonight, Abel faces a major test in his transformation

Greg Abel has been leading Berkshire Hathaway for less than a year, yet he has already made a bet of over $10.9 billion on the AI sector, marking a complete break from Buffett’s traditional avoidance of tech stocks. However, Alphabet’s stock price has fallen below their initial purchase cost, and Bending Spoons continues to decline, putting this bold AI gamble to the test. At the same time, third-quarter earnings per share are expected to drop 6% year-over-year, and the share repurchase program is likely to plummet from $4.5 billion to $1.6 billion. How to deploy $358 billion in cash will be a major challenge for the new leader’s capital allocation skills.

华尔街见闻•2026/11/07 09:11
Just bet on AI and already faced a market blow! Berkshire reports earnings tonight, Abel faces a major test in his transformation

Has the AI bubble burst? Goldman Sachs: It's more like 1998 than 2000 right now

The Goldman Sachs trading desk stated that the current wave of sell-offs resembles the 1998 liquidity crisis more than the bursting of the 2000 bubble. It is a forced deleveraging rather than a refutation of business fundamentals. The market is drastically repricing construction financing and timeline expectations, rather than underlying demand. Moreover, the issues currently drawing the most attention from the market—electricity and licensing—are actually the least important, as limited supply does not equate to disappearing demand. The real question that needs to be answered is whether long-term revenues can ultimately justify the capital invested.

华尔街见闻•2026/11/07 08:26
Has the AI bubble burst? Goldman Sachs: It's more like 1998 than 2000 right now

Tesla Cybertruck: From Cracked Windows to Production Halt, a Three-and-a-Half Year Journey Ends

Since its launch in 2019, Cybertruck has been mired in controversy—ranging from a failed window demonstration on release day, a four-year delay in mass production, and its price rising from $39,900 to more than $100,000, along with a total of 11 recalls. The day before the halt of production was announced, Tesla raised the price once again, bringing a dramatic and intriguing end to the saga of this vehicle.

华尔街见闻•2026/11/07 04:21
Tesla Cybertruck: From Cracked Windows to Production Halt, a Three-and-a-Half Year Journey Ends