ambcrypto.com

$XDC Network [$XDC] has posted a double-digit gain of above 10% in the past 24 hours at press time, driven by a building spot foundation that preceded the surge.
Market analysis indicates that the rally was not spontaneous; four days of buying activity laid the groundwork for the price to rise. Despite this, the asset now sits at a critical edge as indicators show bulls beginning to exit the market.
How did $XDC’s price surge?
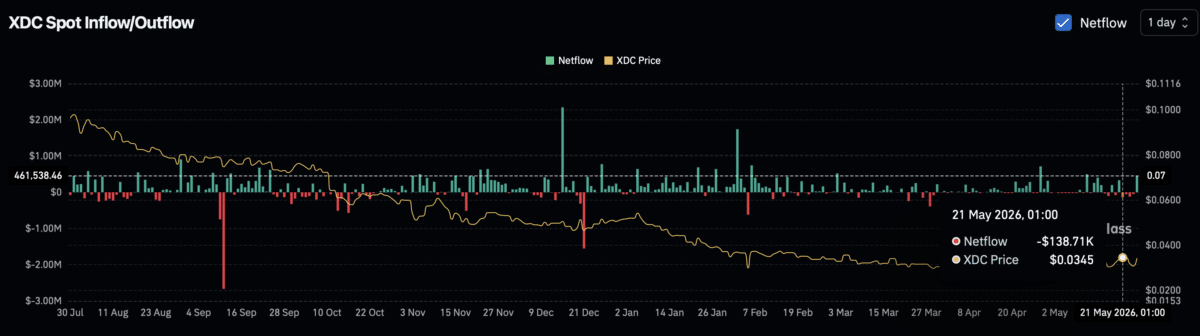
CoinGlass data showed that $363,830 was spent acquiring $XDC between the 21st and 24th of May, reflecting a period where investors were steadily accumulating the asset, likely viewing it as undervalued at those levels.
 Source: CoinGlass
While profit-taking has since begun in the spot market, perpetual traders have stepped in to add capital, with Open Interest (OI) climbing 9.97% to $4.8 million as of writing.
This activity has added further momentum to the ongoing accumulation that has benefited $XDC over the past 24 hours. However, with indicators now showing early signs of bulls scaling back, the asset faces growing pressure from both sides.
$XDC approaches the supply zone as accumulation fades
Clear pressure is building against $XDC as the asset approaches a territory that historically signals buyer exhaustion.
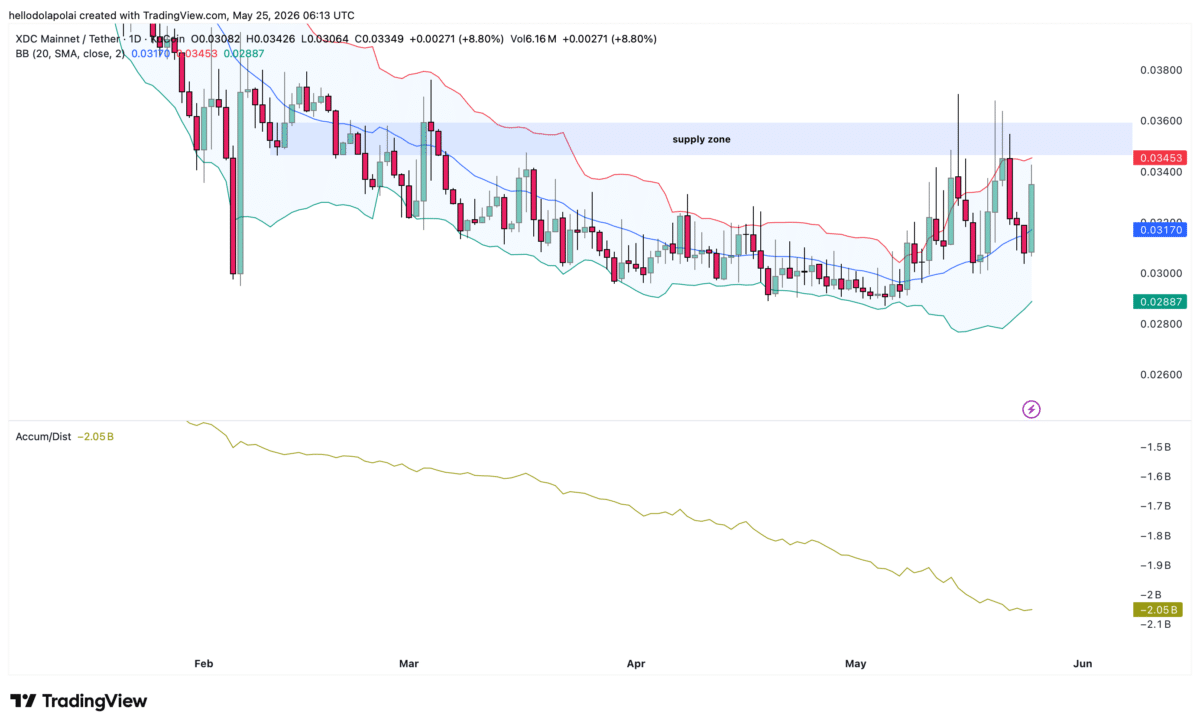
At the time of writing, $XDC was on the verge of hitting the upper Bollinger Band, the overvalued zone, which notably coincides with a supply zone on the chart. Whenever price approaches this level, it signals that buyers are becoming exhausted and increases the tendency for a decline.
 Source: TradingView
The Accumulation/Distribution indicator compounded this reading as the A/D declined and then flattened, sitting at approximately -2.05 billion in accumulated volume.
This combination of price nearing full exhaustion alongside a fading A/D indicator suggests investors and traders are scaling back, and further capital outflows from $XDC appear increasingly likely.
Liquidity clusters sit below price
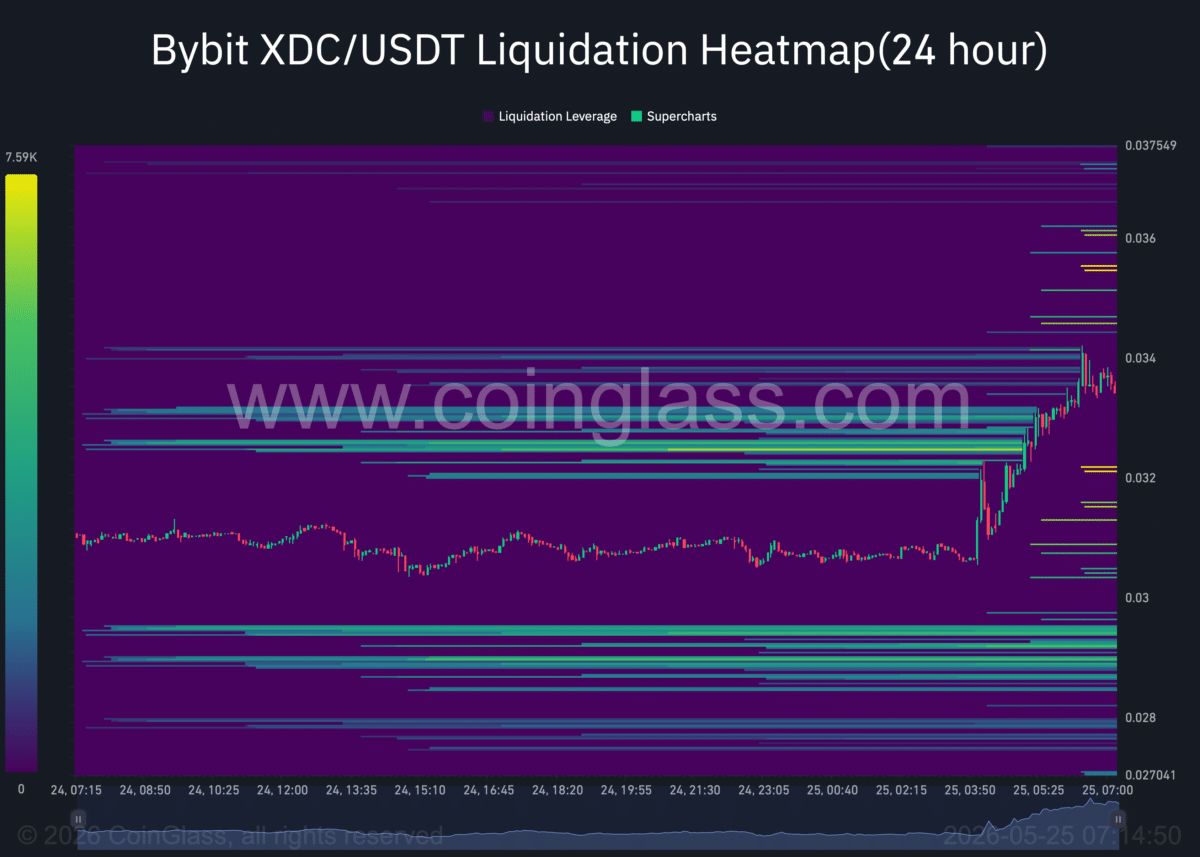
The liquidation heatmap reveals limited liquidity on the chart overall, with the clusters that do exist sitting predominantly below price rather than above it.
Liquidity clusters act as attraction points on the chart, drawing price toward them over time, and the current placement of clusters below price increases the probability of a move lower.
 Source: CoinGlass
Notably, this has yet to materialize as perpetual contracts remain tilted in favor of bulls, with the Funding Rate holding slightly positive at 0.0050%.
A shift in the Funding Rate turning negative would add to the exit pressure, as short contracts would begin to accumulate and weigh on price. For now, the rate keeps the immediate bearish scenario at bay, but the broader market structure points toward a clear downturn ahead.
Final Summary
- Spot buyers spent $363,830 on $XDC in the past four days, with perpetual market OI rising 9.97% to $4.8 million.
- $XDC is approaching the upper Bollinger Band and a supply zone simultaneously as the A/D indicator drops to 2.05 billion in volume.