
Bitcoin hits $73K as cool US CPI data shows 60-year record gas price hike

Bitcoin (BTC) tagged $73,000 following Friday’s Wall Street open as crucial US inflation numbers came in below expectations.
Key points:
Bitcoin edges higher as US CPI data remains slightly below market expectations.
Gasoline prices see a historic surge within the CPI release.
Bitcoin traders plan out key resistance levels overhead.
BTC price seeks new local highs after CPI
Data from TradingView showed BTC price eyeing new multi-week highs as markets digested the March print of the Consumer Price Index (CPI).
 BTC/USD one-hour chart. Source: Cointelegraph/
This was the week’s key macro data release, and the first CPI report to reflect the impact of the US and Israel war in Iran.
Gasoline prices jumped over 21% month-on-month, the Bureau of Labor Statistics (BLS) confirmed, but overall CPI finished 0.1% lower than markets’ expectations.
“Over the last 12 months, the all items index increased 3.3 percent before seasonal adjustment,” an official news release read.
“The index for energy rose 10.9 percent in March, led by a 21.2-percent increase in the index for gasoline which accounted for nearly three quarters of the monthly all items increase.”
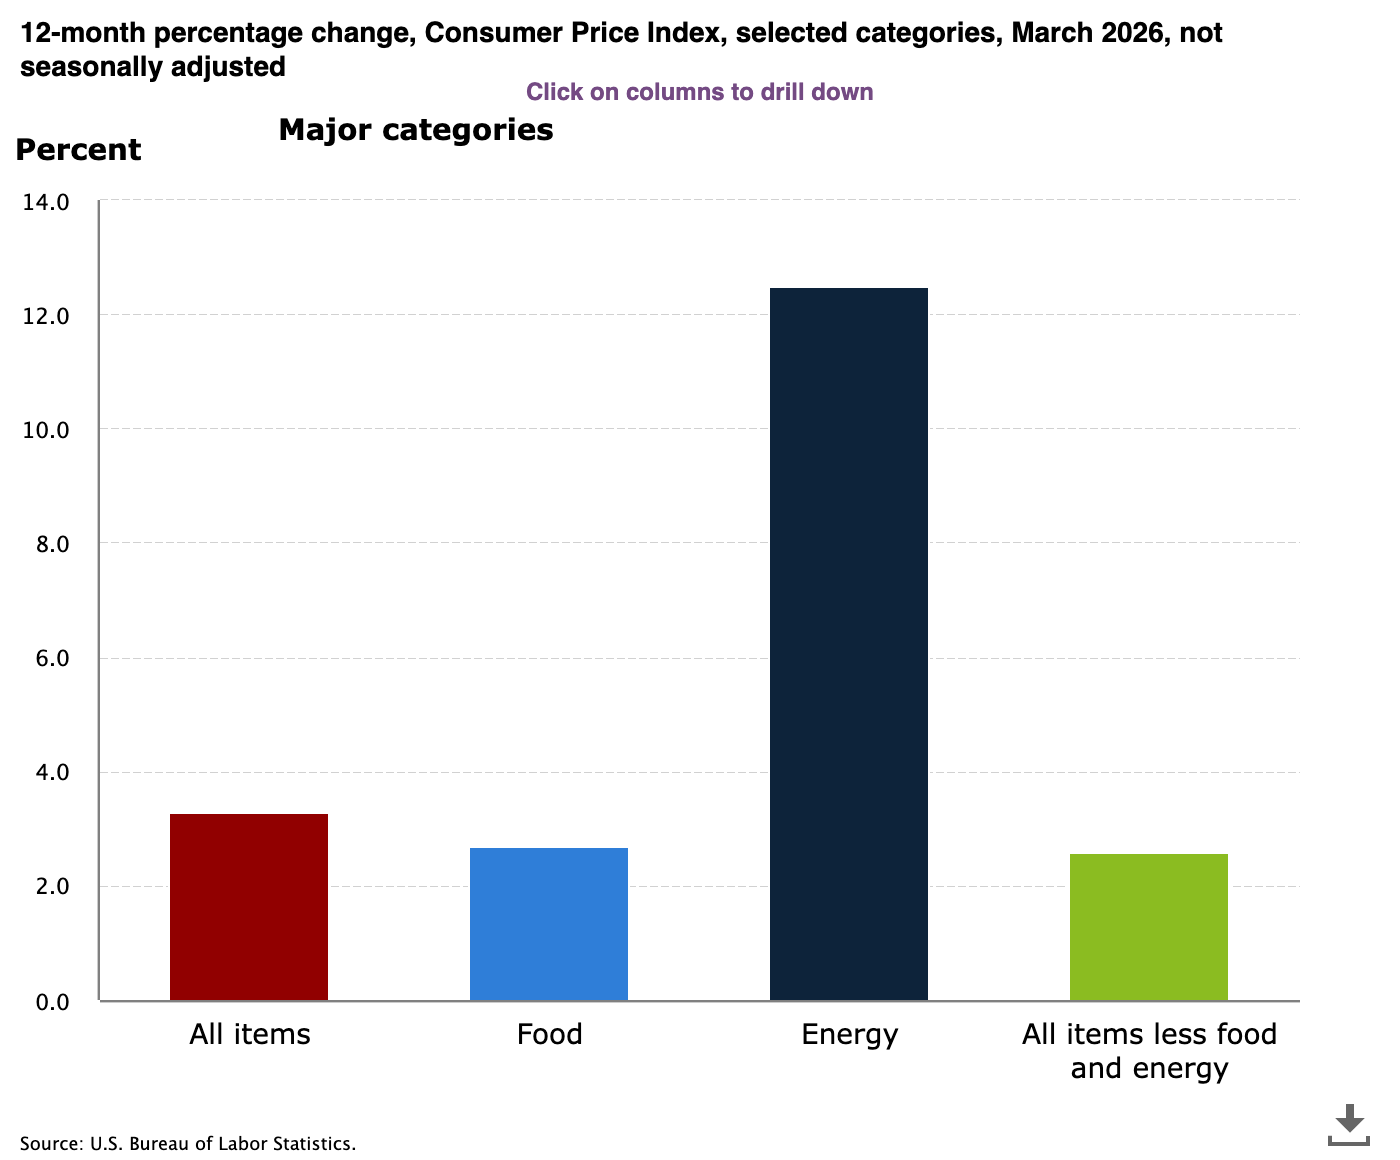 US CPI 12-month % change. Source: BLS
Reacting, trading resource The Kobeissi Letter noted that the gas-price CPI jump was the largest monthly gain since 1967. The energy increase, it added in a further post on X, was the largest since 2005.
With the resulting mixed picture of inflationary forces, US stocks were mostly flat at the open, while BTC price action also avoided major moves up or down.
 Fed target rate probabilities (screenshot). Source: CME Group
Markets, however, had no hope for the Federal Reserve cutting interest rates — a conclusion already in place on the back of Thursday’s Personal Consumption Expenditures (PCE) index release, per data from CME Group’s FedWatch Tool.
Bitcoin traders draw the next resistance zones
Among Bitcoin market participants, there was modest reason for optimism over the short-term price outlook.
Related: Bitcoin analysis sees $55K BTC price 'iron bottom' by December 2026
In their latest X analysis, trader JDK Analysis flagged BTC/USD acting within a narrowing wedge — a topic of debate since February.
“If price makes another attempt at the current key high, the reaction there will be critical!” they wrote in accompanying commentary.
 BTC/USD perpetual contract eight-hour chart. Source: JDK Analysis/X
Trader Daan Crypto Trades meanwhile eyed exchange order-book liquidity below $74,000.
Liquidity levels to watch in close proximity are that ~$71K region below, and $73K-$74K above (local high).
— Daan Crypto Trades (@DaanCrypto) April 10, 2026
Earlier, Cointelegraph reported on a copycat signal from Bitcoin’s relative strength index (RSI) that began to echo the end of the 2022 bear market.
Disclaimer: The content of this article solely reflects the author's opinion and does not represent the platform in any capacity. This article is not intended to serve as a reference for making investment decisions.
You may also like
Peter Schiff Predicts More Losses for Bitcoin as BTC Goes Below 2021 High

Microsoft (MSFT.US) 365 services experience second major outage this year, affecting multiple government agencies and enterprises worldwide
Despite a "partial recovery," the latest Microsoft service outage continued into Asia-Pacific business hours.
Nvidia (NVDA.US) New CEO Candidates and Market Predictions: Trump Nominates Cook as Successor
As the successor remains uncertain, external voices have already begun to "make choices" for Nvidia.

Safe haven halo fails? US Treasury sell-off returns, Wall Street just breathed a sigh of relief and is startled again
Just as global bond investors began to believe that the worst phase of this year's sell-off had passed, the surge in U.S. Treasury yields has forced them to reassess that judgment.

Crypto prices
More


