
Gold Price Outlook for March 12 – Important Intraday Entry Points for Active Traders

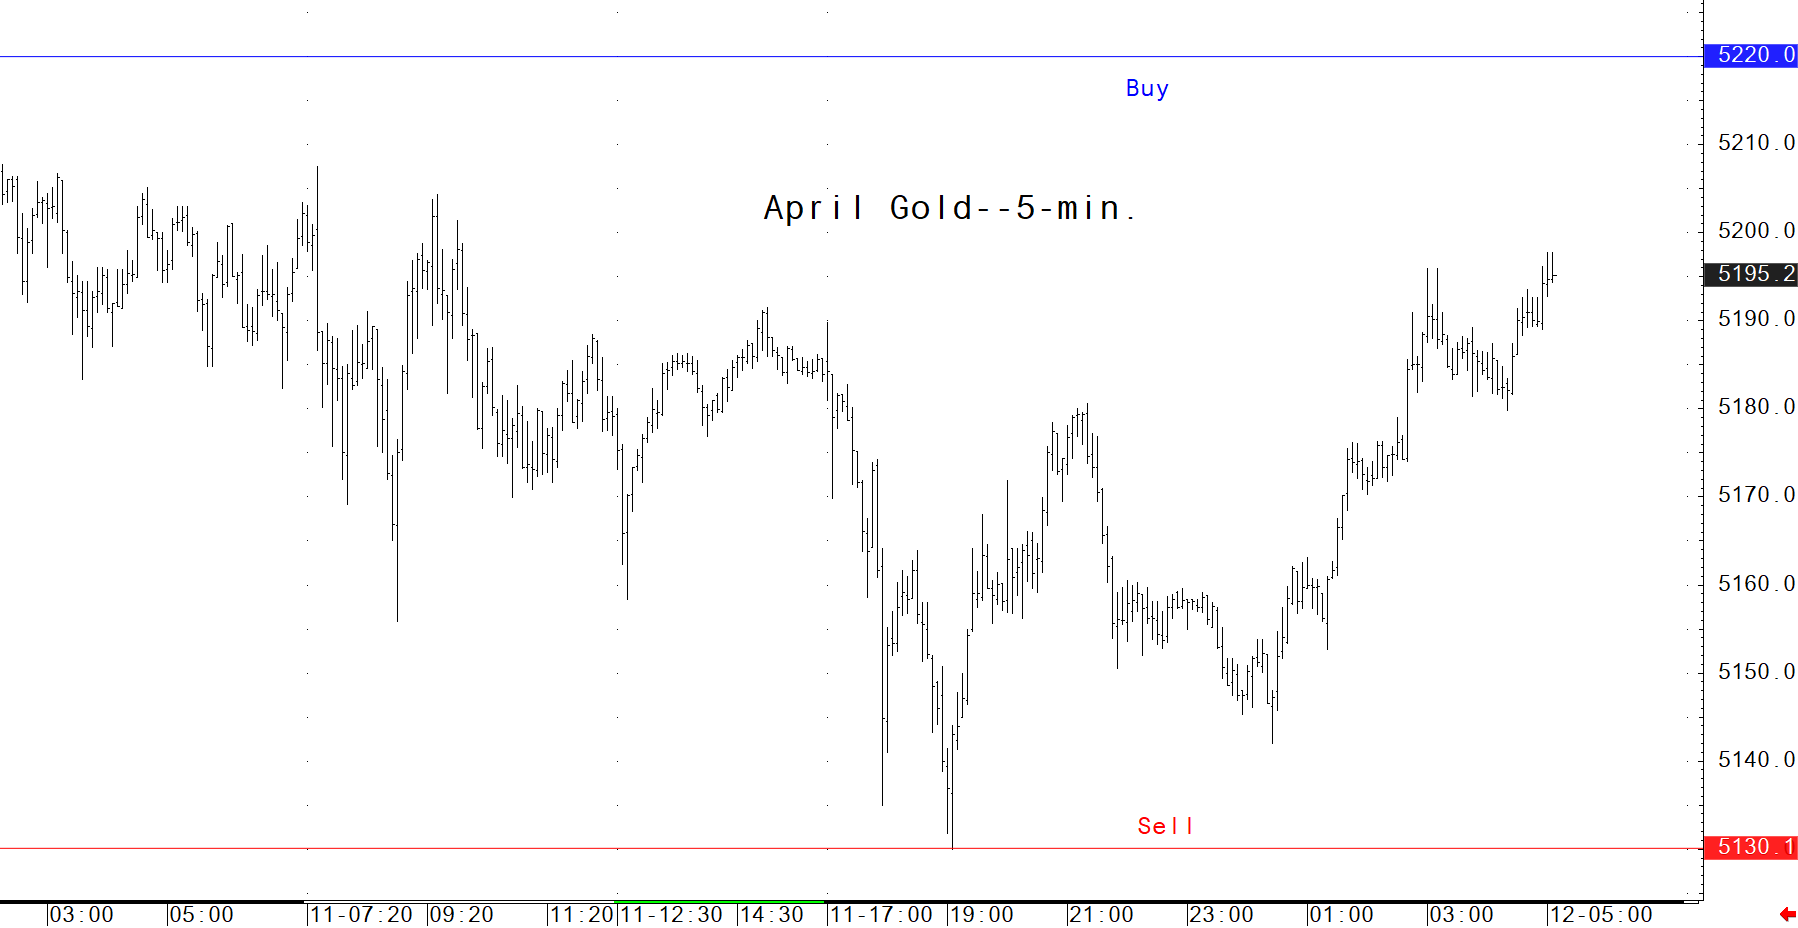
Comex Gold Futures: 5-Minute Chart Insights
For those who actively trade or monitor gold futures throughout the day, this 5-minute bar chart offers a powerful resource for analysis and decision-making. By highlighting crucial short-term support and resistance zones, it helps identify optimal points for entering buy or sell positions. (Keep in mind: seasoned traders often buy when prices begin to rise and sell when prices start to decline.) If you’re engaged in intra-day gold trading, this exclusive daily chart—available only at Kitco—is an essential tool you won’t want to miss.
Disclaimer: The content of this article solely reflects the author's opinion and does not represent the platform in any capacity. This article is not intended to serve as a reference for making investment decisions.
You may also like
Ovintiv Inc. Is Maintained at Overweight by Barclays
Rare Earths Americas doubles mineralized zone at Homer project in Brazil

Wall Street Trading Booms on Crypto Exchanges. Which Tokens Benefit?

CEREBRAS SYSTEMS INC <CBRS.O>: MIZUHO CUTS TARGET PRICE TO $240.00 FROM $300.00
Crypto prices
More


