
Top Gap Ups and Downs on Thursday: TM, SCCO, BKNG and More

Welcome to the Daily Gap column!
In the realm of technical analysis, gaps are often viewed as critical indicators of potential price movements. Particularly those that emerge at market open, these gaps can signify dramatic shifts in market sentiment.
. The directionality of these gaps provides traders with insights into short-term trends, allowing them to develop corresponding trading strategies.Here is the showcase of the top 10 stocks with the largest gap sizes as of yesterday's close. The "Gap %chg" metric indicates the magnitude of these gaps, with all included stocks reaching a market capitalization of $5 billion.

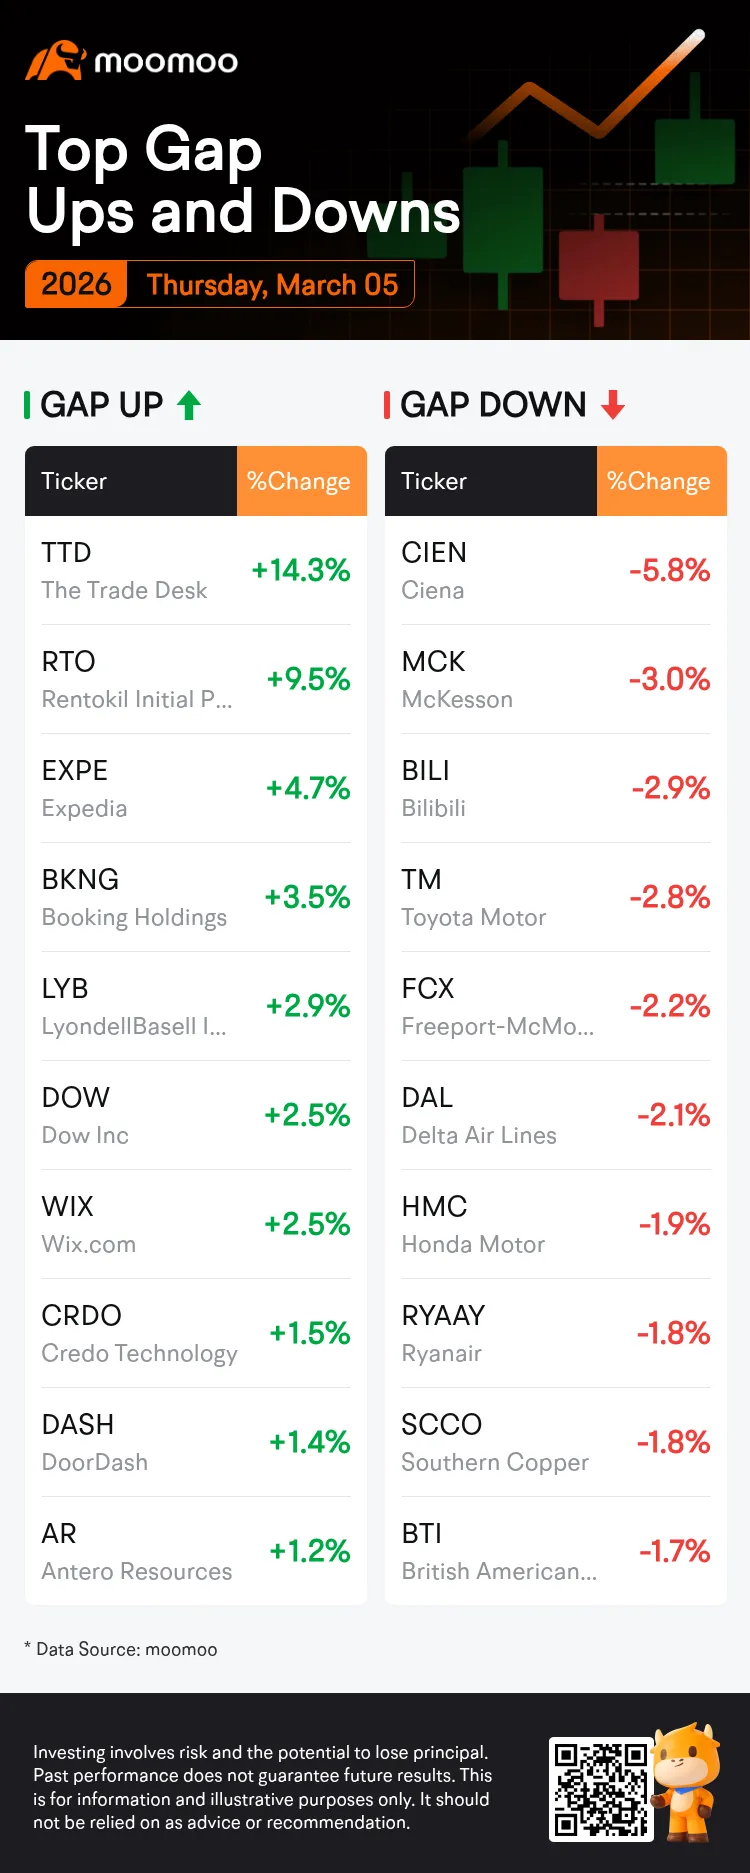
Additionally, we highlight stocks that have exhibited the longest streak of consecutive gaps in either up or down direction over the past 250 trading days. These stocks are also filtered with the same market capitalization criterion.
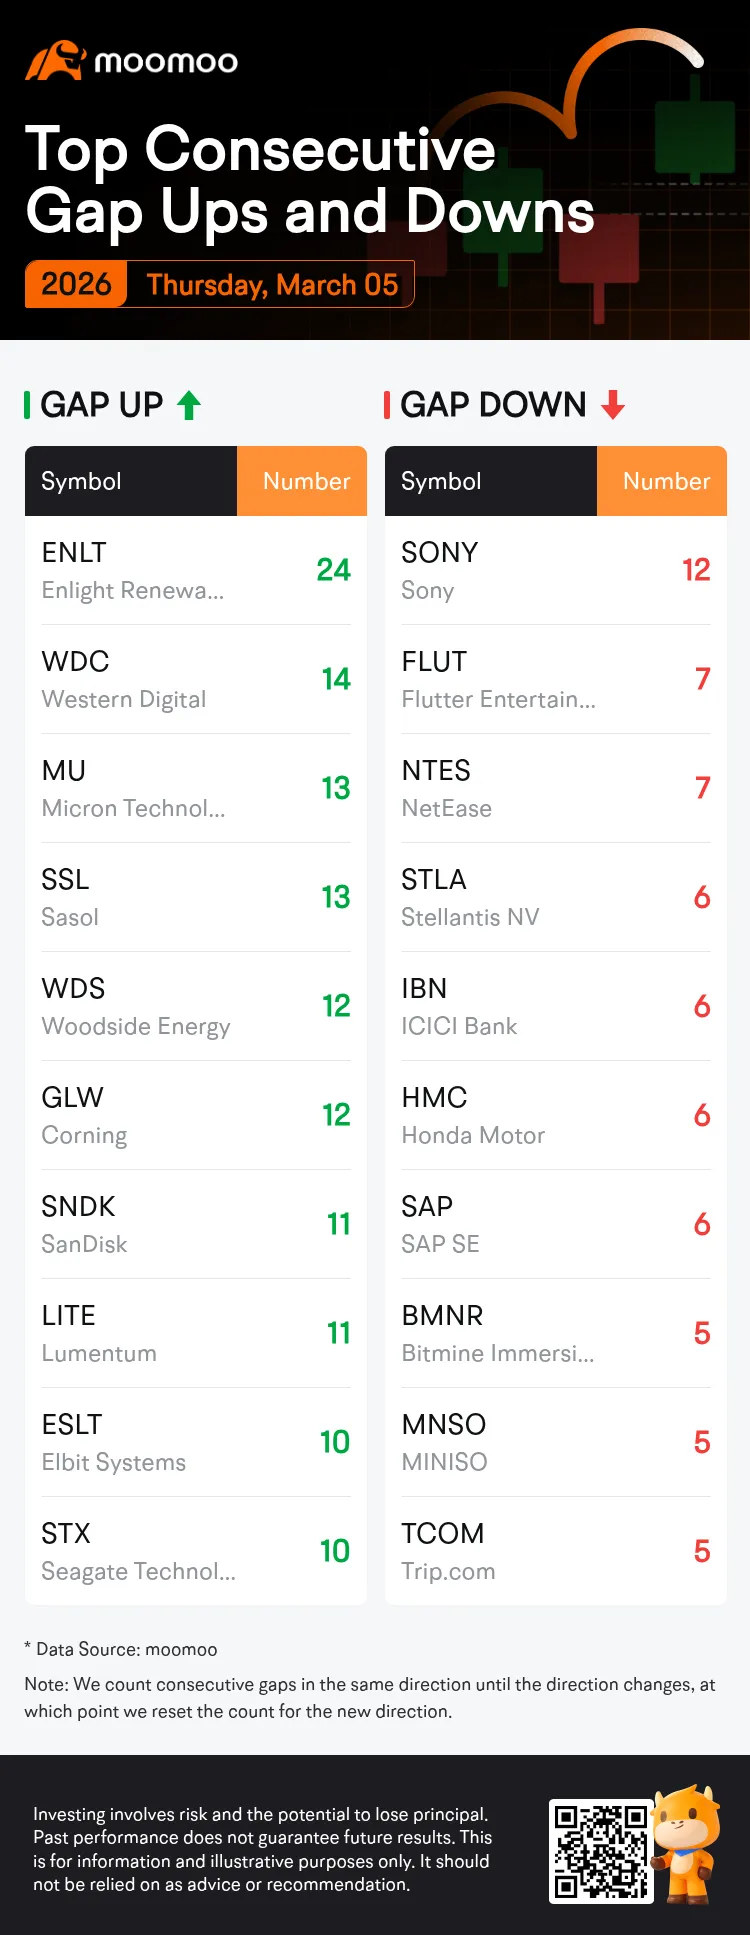
Technical traders believe that gaps can provide directional clues, but the accuracy of a single indicator is not sufficient to predict stock movements. Investors still need to incorporate various factors, including board market sentiment, company fundamental factors, technical indicators, and so on.
Options strategies can be an effective way to capitalize on anticipated price movements in different trending scenarios.
For investors optimistic about a stock's upward trajectory, some commonly utilized options strategies include the Long Call, the Bull Call Spread, and the Cash-Secured Put, each with different risk levels.
The Long Call involves purchasing a call option, limiting risk to the premium paid while offering potentially unlimited profit if the stock rises. The Bull Call Spread is a more conservative approach, where investors buy a call at a lower strike and sell another at a higher strike, reducing costs and capping both gains and losses. Alternatively, the Cash-Secured Put involves selling a put option while holding enough cash to buy the stock at the strike price if assigned, allowing investors to potentially acquire the stock at a discount while generating premium income.
For investors anticipating a downward trend in a stock, several options strategies can be employed, each with varying risk levels.
The Long Put strategy involves purchasing a put option, granting the right to sell the stock at a specified strike price before expiration. This strategy offers significant profit potential if the stock price declines, with risk limited to the premium paid for the option. The Bull Put Spread combines selling a put option at a higher strike price while simultaneously buying another put option at a lower strike price, allowing traders to collect premium income while capping potential losses, thus providing a more balanced risk-reward profile. Another strategy is the Covered Call, where an investor sells a call option, committing to sell the stock at the strike price if exercised. This generates income if the stock stays flat or falls but caps upside potential if the stock surges, making it best for experienced traders.
What are gaps?
Price charts sometimes have blank spaces known as gaps (up gaps and down gaps), where the price of a stock moves sharply up or down, with little or no shares traded in between. This is why the asset's chart shows a gap in the normal price pattern. Normally this occurs between the close of the market on one day and the next day's open.
For an up gap, the low price of the day must be higher than the high price of the previous day. A down gap is just the opposite of an up gap.
Gaps can show signals that something important has happened to the fundamental or the psychology of traders that accompanies this market movement.
For example, if an unexpectedly high earnings report comes out after the market has closed for the day, a lot of buying interest could be generated overnight, leading to an imbalance between supply and demand. When the market opens the next morning, the stock price will likely rise in response to the increased demand from buyers. If the stock price remains above the previous day's high throughout the day, then an up gap is formed.
Disclaimer: The content of this article solely reflects the author's opinion and does not represent the platform in any capacity. This article is not intended to serve as a reference for making investment decisions.
You may also like
Nvidia falls to its lowest valuation in 14 years! "Super bull" Tom Lee calls for bottom fishing, retail investors are buying more as it drops, but Wall Street is divided
After the market opened on Thursday, retail investors went against the trend and bought up Nvidia, with net purchases reaching $111 million in just half an hour, setting a record for the same period. Investors such as Tom Lee have publicly supported the company, with institutions optimistic about strong order backlogs extending to 2028, robust revenue growth, and opportunities created by declining valuations. Meanwhile, institutions like Bernstein and Goldman Sachs have become more cautious about Nvidia's outlook, with concerns focusing on management succession and technological leadership following Jensen Huang's departure.
Jane Street boosts Fidelity Bitcoin ETF stake 8x in Q3, trims BlackRock IBIT

From SpaceX to Anthropic, the market has new strategies for dealing with tech giants' IPOs
The market's response strategies to major listings are currently centered around "index inclusion expectations": the new regulations allow mega IPOs to be included in the six major indices within 15 days, triggering concentrated buying by passive funds. Investors are positioning themselves in advance and using options to hedge and amplify buying power. However, Anthropic has a free float of only about 6%; shares available for sale by employees on the first day and privately placed shares with no lock-up period may create supply pressure. On the other hand, index arbitrageurs are facing a rare opportunity.

Nvidia Q3 Earnings Preview: Revenue Expectations and Key Metrics to Watch
Crypto prices
More


