
Bitcoin bottom fractal calls for 130% rally, but is the model valid in 2026?

A Bitcoin (BTC) bottom signal that appeared in 2023, ahead of a 130% rally in 2024, has flashed again this week, raising the possibility that the price is nearing another bullish inflection point.
At the same time, the broader data of liquidity, exchange-traded fund (ETF) flows, and macroeconomic data changes the environment from two years ago, suggesting that the path forward may not mirror the previous cycle’s.
BTC bottom trigger appears without strong follow-through
Data aggregator Swissblock noted that Bitcoin has now logged 25 consecutive days in its “extreme high risk” zone, the longest stretch on record and above the 23-day peak seen in 2023. Historically, an extended stay in this zone has aligned with late-stage drawdowns or a bottom signal.
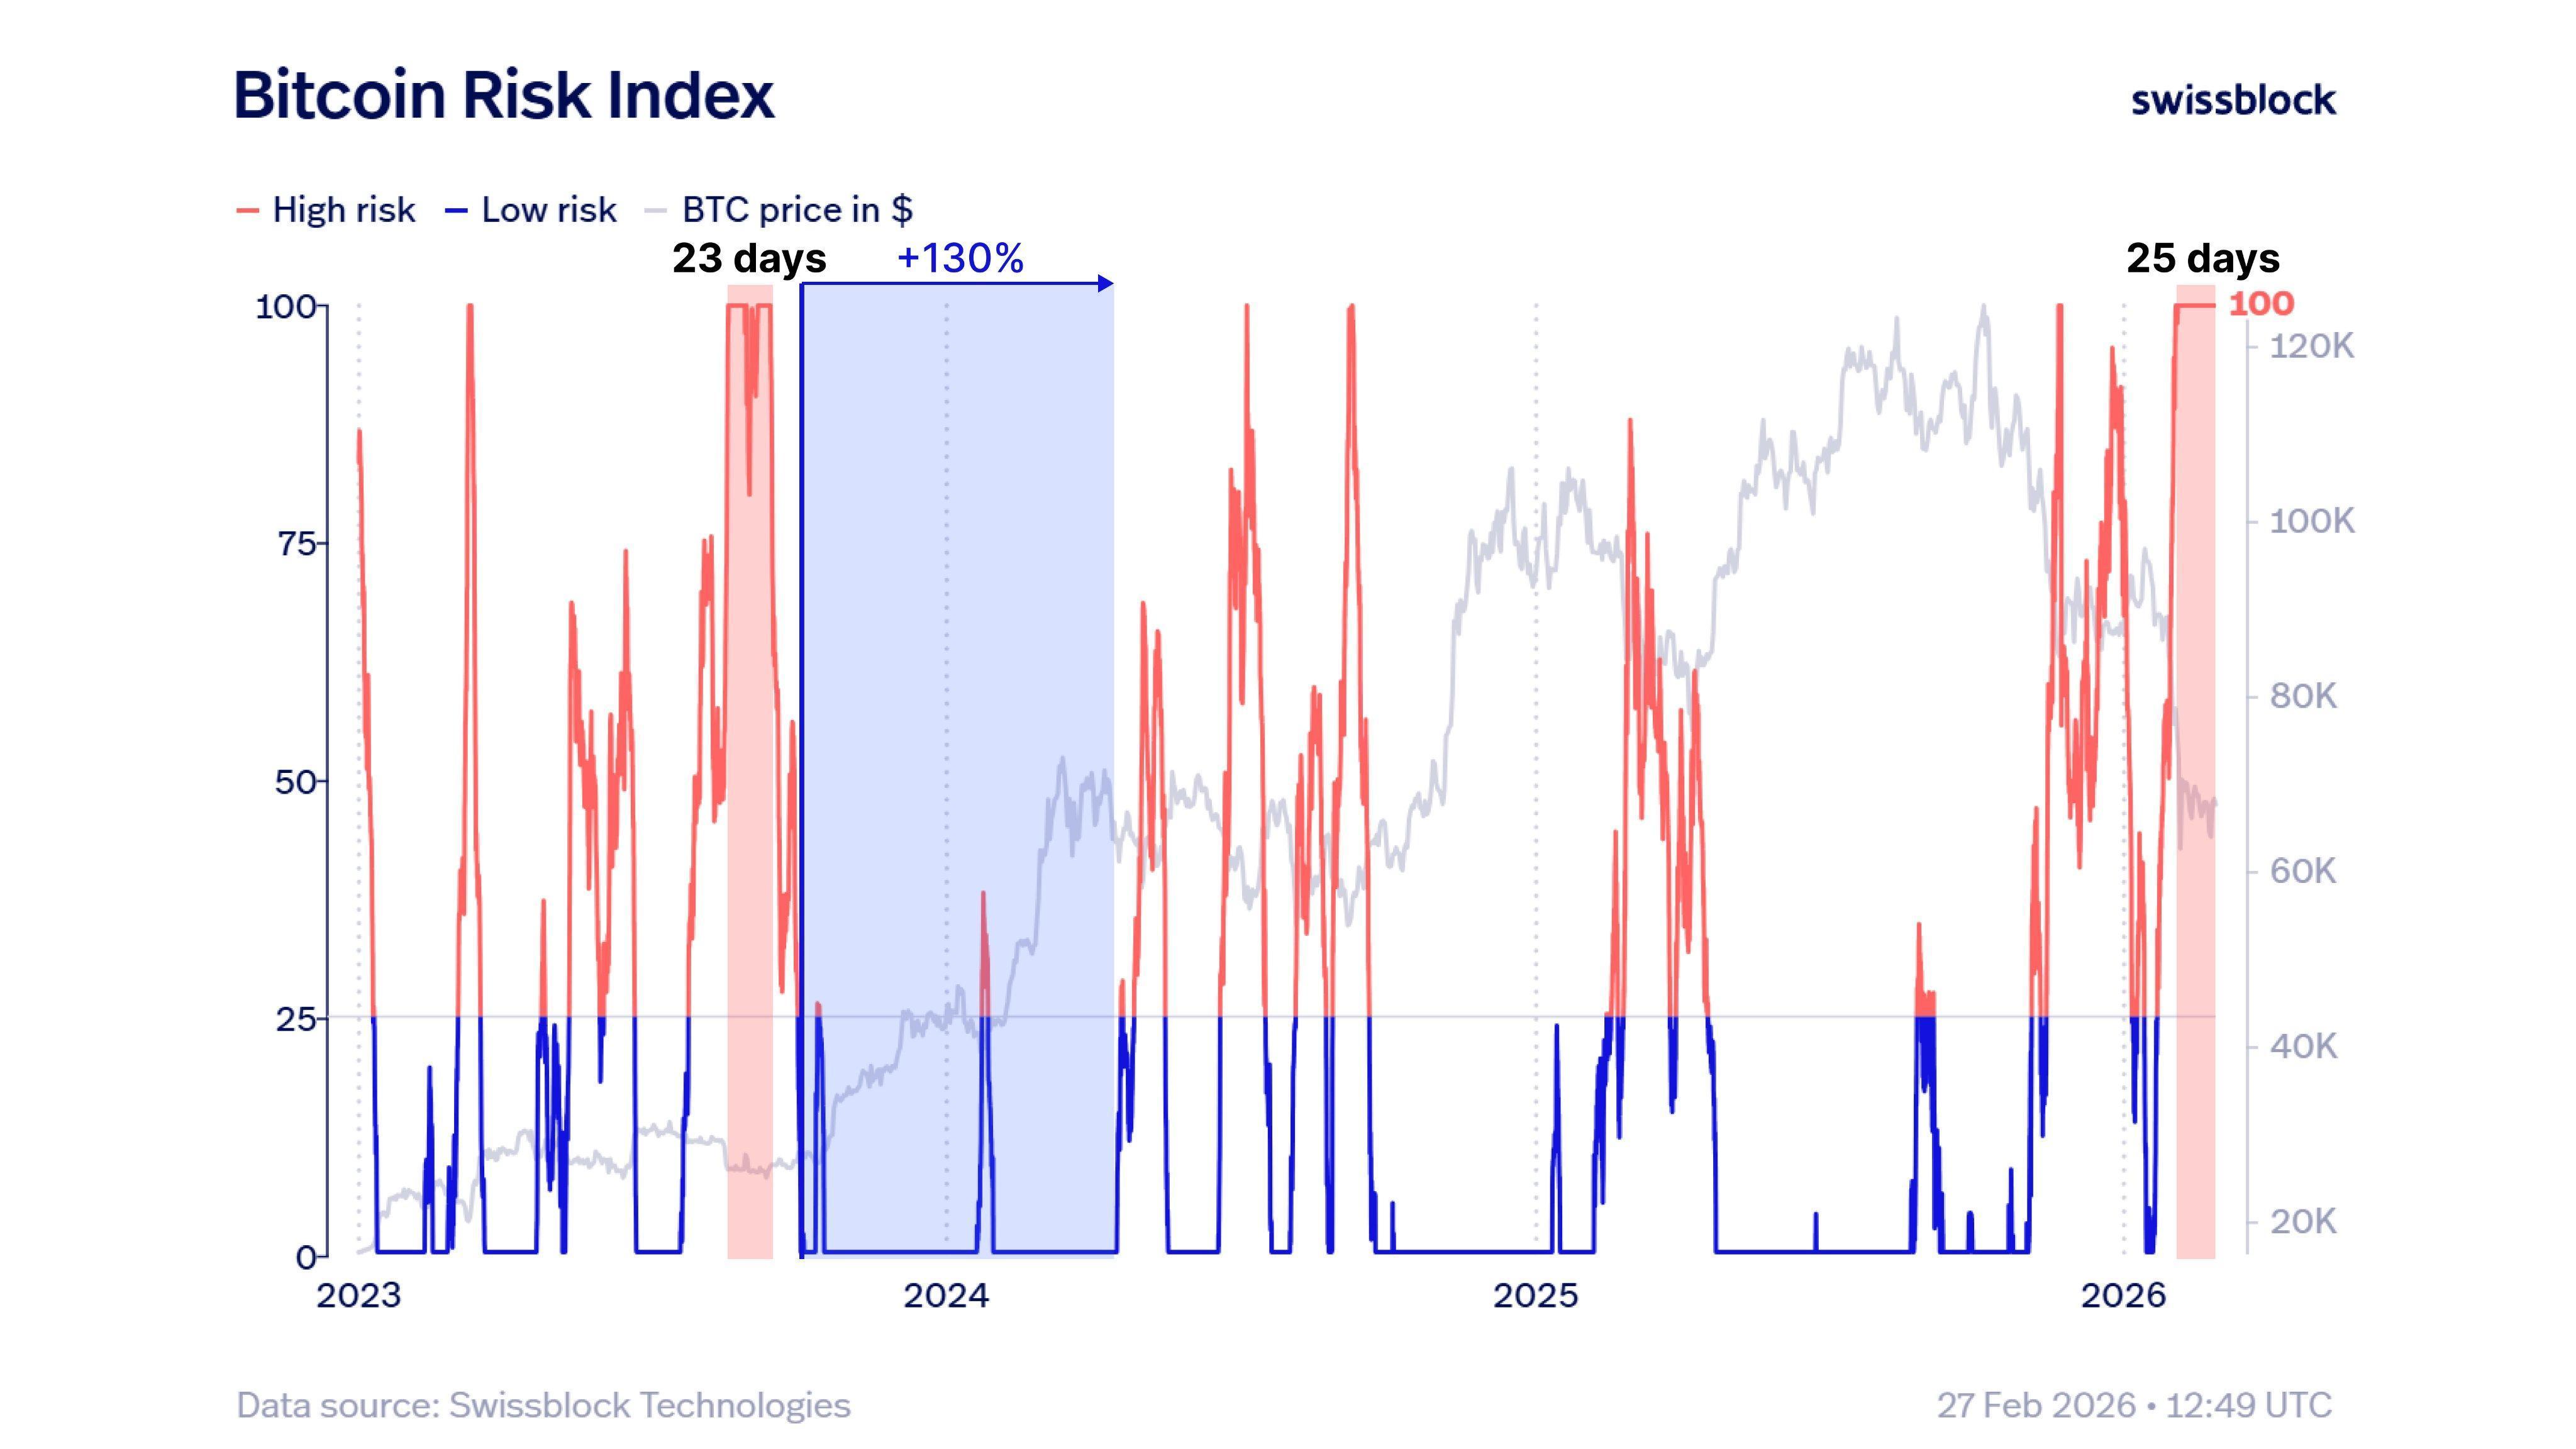 Bitcoin Risk Index. Source: Swissblock/X
MN Capital founder Michaël van de Poppe also pointed to the BTC versus supply in the profit/loss chart, which shows the price interacting with levels that previously marked bottoming phases. In 2023, the shift from high risk to low risk coincided with the start of a powerful bullish expansion.
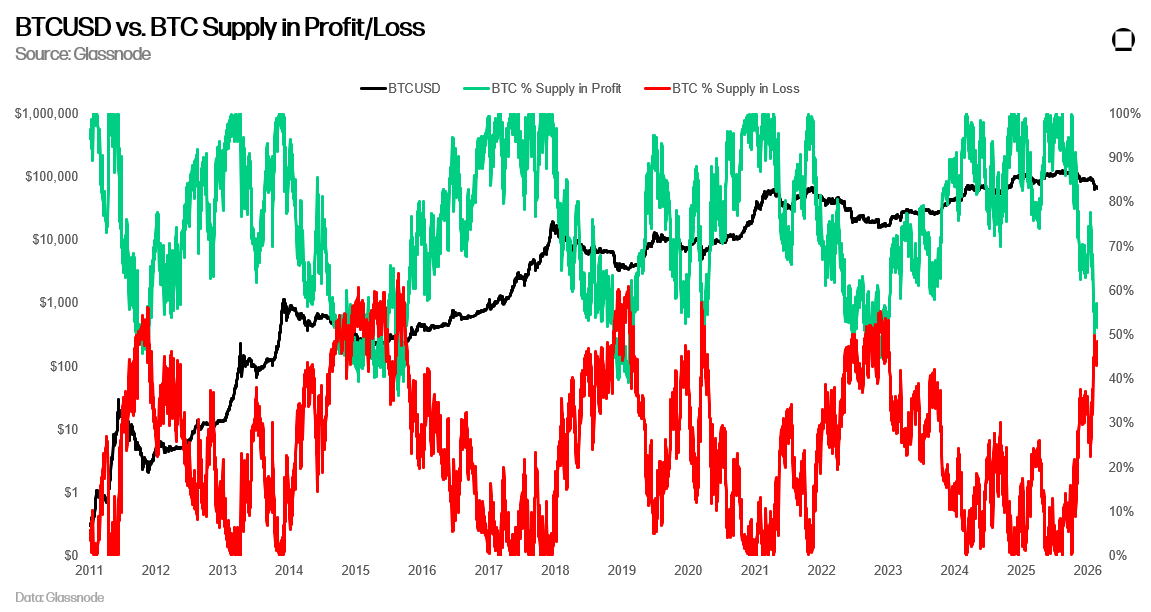 BTCUSD vs BTC supply in profit/loss. Source: Michael van de Poppe/X
Trader positioning is not in sync with an uptrend. RugaResearch noted that 30-day apparent demand continues to flip between positive and negative. While the selling pressure has faded, sustained buying demand has not maintained its dominance.
Related: Bitcoin to $30K? Analysts debate when and at what price BTC will bottom
Deeper Bitcoin drawdowns take time
Macroeconomic newsletter Ecoinometrics highlighted that a BTC decline of this magnitude rarely resolves quickly. Excluding the 2020 COVID rally, which was supported by aggressive monetary policy intervention, the recoveries from 50% drawdowns developed over an extended period.
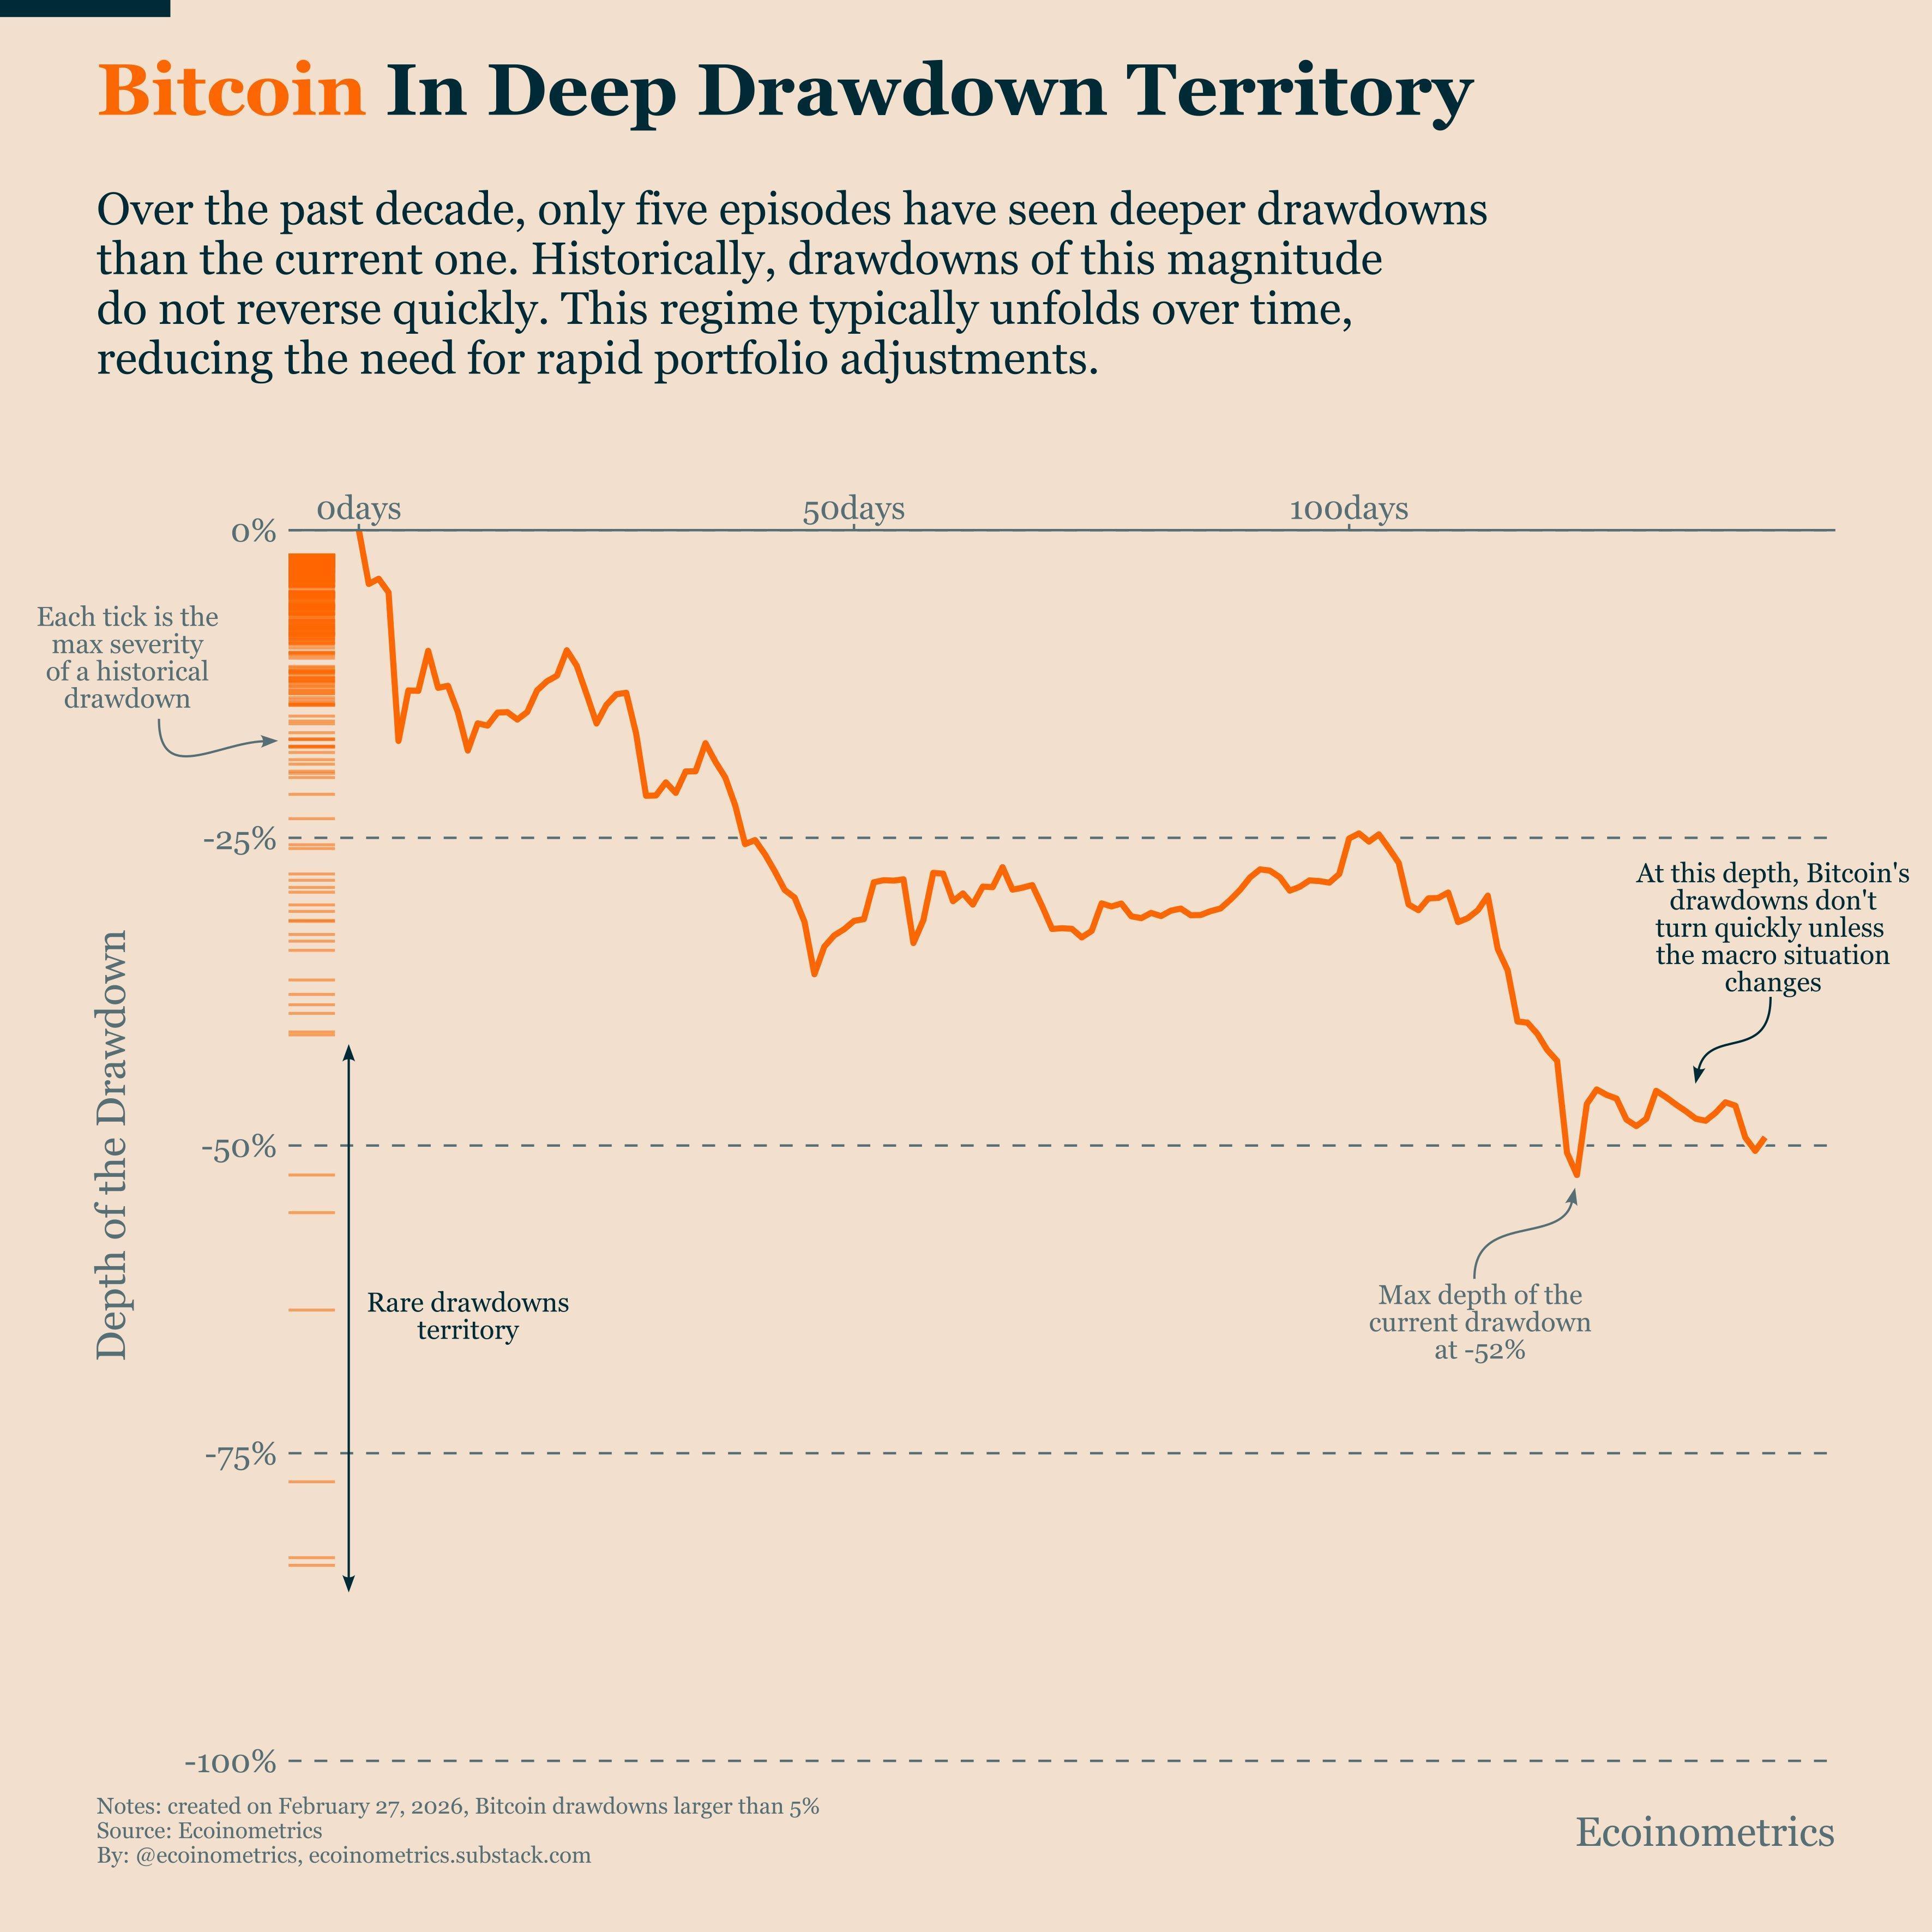 Bitcoin is in deep drawdown territory. Source: Ecoinometrics
The ETF flow data reinforces the cautious tone. Since August, cumulative inflows into gold ETFs have surpassed spot Bitcoin ETF flows on a 90-day rolling basis. Over the same period, Bitcoin funds have posted negative flows on a 90-day average rolling basis, currently sitting at –$2.06 billion.
The inflation trends added further context. Ecoinometrics noted that the headline Personal Consumption Expenditures (PCE) sits near 2.9% year-on-year, with core near 3.0% and core services above 3.4%. The Federal Reserve targets PCE, and the recent trend has not shown a clear downward shift. Without easing expectations, the liquidity expansion looks limited.
The price levels frame the debate. CMCC Crest Managing Partner Willy Woo said that any short-term relief rally to $70,000 to $80,000 is likely to be met with another round of selling pressure, since “the broader regime is heavily bearish with both spot and futures liquidity deteriorating”.
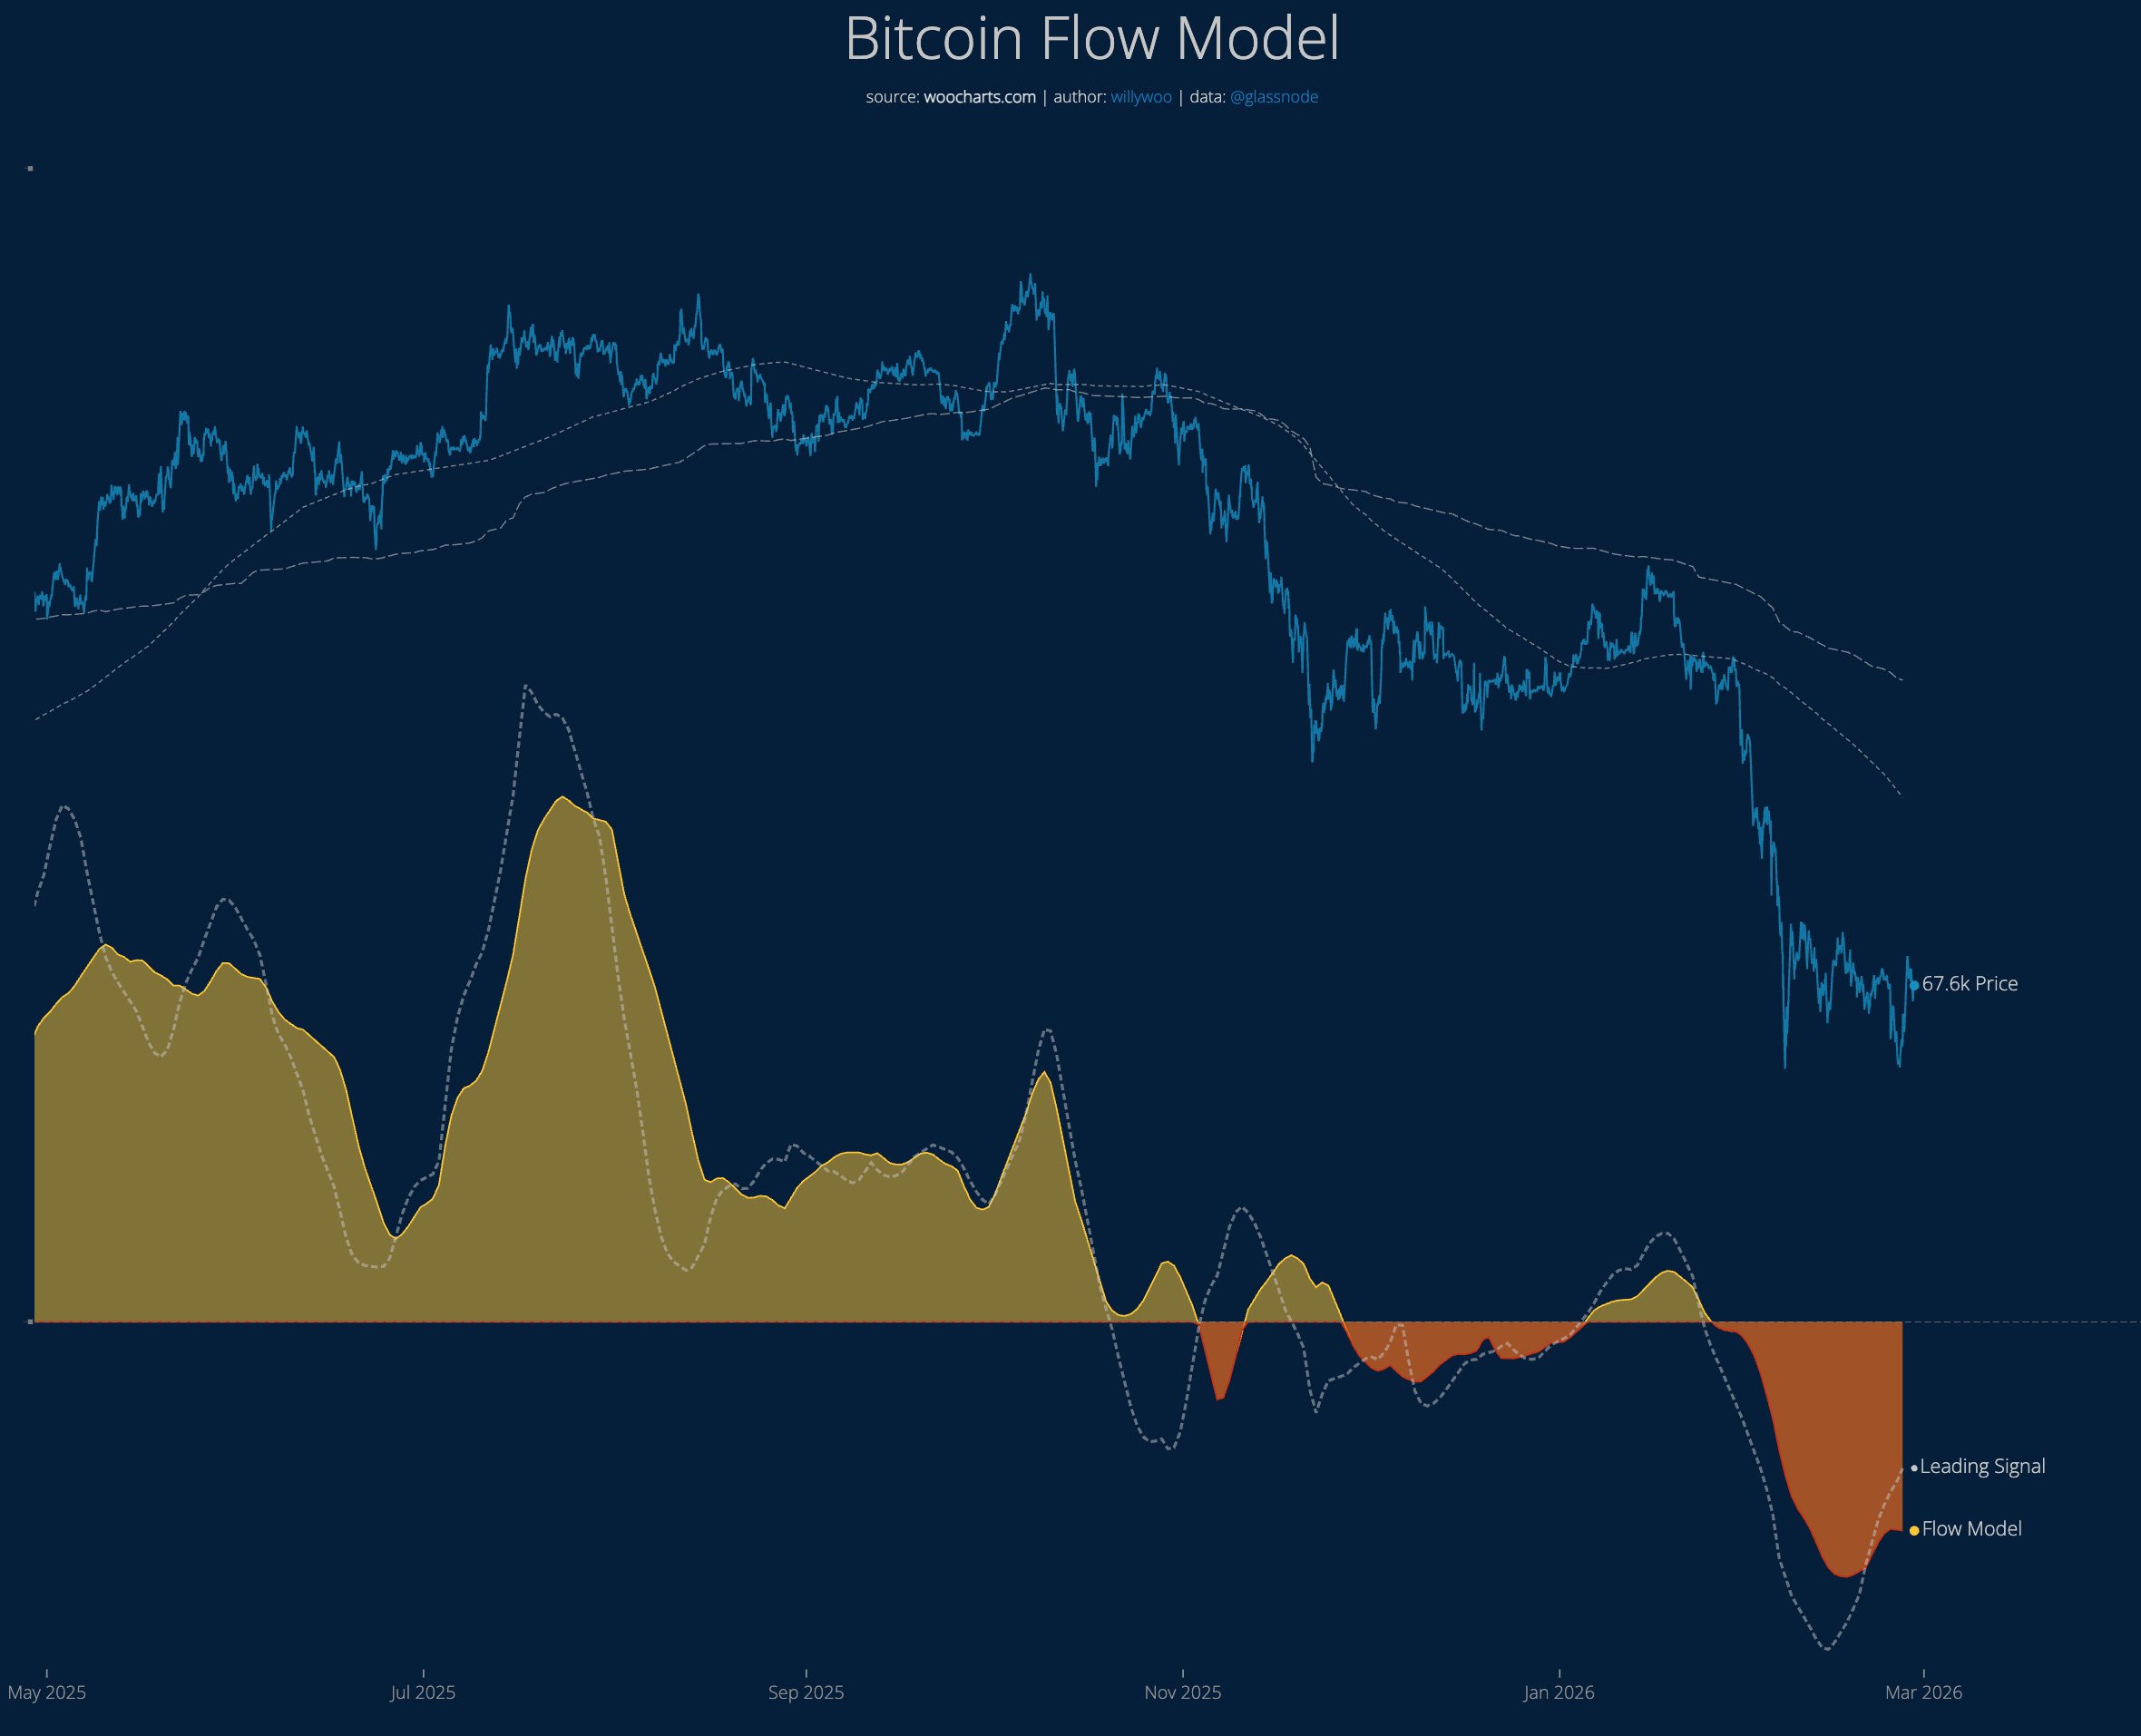 Bitcoin Flow Model. Source: Willy Woo/X
Woo said that the $45,000 level aligns with the prior bear market. Below that, $30,000 and $16,000 mark the historical support, which is tied to longer-term trend preservation.
Related: Crypto taxes updated, BTC stuck below $70K: Month in charts
Disclaimer: The content of this article solely reflects the author's opinion and does not represent the platform in any capacity. This article is not intended to serve as a reference for making investment decisions.
You may also like
AI trading retreats and corporate profit growth boost European stocks! Four-day winning streak halted but still on track for biggest weekly gain since July
European stock markets had previously risen for four consecutive trading days and reached record highs, but this rally could not be sustained. The Stoxx Europe 600 Index has climbed 2.2% this week and is on track for its largest weekly gain since July.
Nebius (NBIS.US) Q3 Conference Call: CEO Says AI “Demand Is Real and Huge”, Expects Pre-tax Break-even by Q4 2027
Nebius Group (NBIS.US) will release its Q3 2026 financial results before the market opens on November 12 (US Eastern Time) and hold a conference call on the same day.
Jensen Huang's resignation drags down AI trading, US three major stock index futures collectively fall, Nvidia stabilizes pre-market, Brent crude rebounds and breaks through $96
Nasdaq 100 index futures fell over 0.3%, and S&P 500 index futures declined 0.14%. Brent crude oil rose 0.37% to $96 per barrel. Spot gold increased 0.4% to $3,893.48 per ounce. Investors are now focusing on the US PPI data to be released tonight.
Invesco's Q3 Holdings Shuffle: Reduced Nvidia (NVDA.US) and Semiconductor Equipment Positions, SpaceX (SPCX.US) Holdings Surge to Over $10 Billion
Invesco has submitted its Q3 holdings report (13F) for the period ending September 30, 2026.
Crypto prices
More


