

The privacy-focused cryptocurrency Zcash [ZEC] has recorded one of the steepest declines in the broader market, shedding double-digit value in recent sessions.
Its continued weakness has raised pressing questions among market participants: can ZEC stabilize at current levels, or is a deeper drawdown ahead?
The market structure
On a year-to-date basis, ZEC has plunged approximately 62%, with little evidence of a sustained recovery or meaningful bounce that would suggest a major trend reversal.
The asset now trades within a tight consolidation range between $225 and $205 on the chart. This zone has previously acted as support on two separate occasions, making it a decisive technical area.

Source: TradingView
This level will likely determine the next directional move. If buyers defend the zone as they did before, ZEC could stage another rebound. However, a breakdown below this support would expose the asset to further downside, potentially accelerating losses beyond prior declines.
A confirmed breach could open the path toward the next visible support near $120, implying an additional downside risk of nearly 30% from current levels.
Such a move would significantly weaken the broader structure and place long-term holders under renewed pressure.
Indicators show persistent weakness
Technical indicators reinforce the bearish outlook. Capital continues to exit the market, as reflected by the Money Flow Index (MFI).
The MFI measures the inflow and outflow of capital using a scale from 0 to 100. Readings between 50 and 80 generally indicate bullish conditions, while levels between 20 and 50 suggest weakness. Values below 20 typically signal oversold territory.
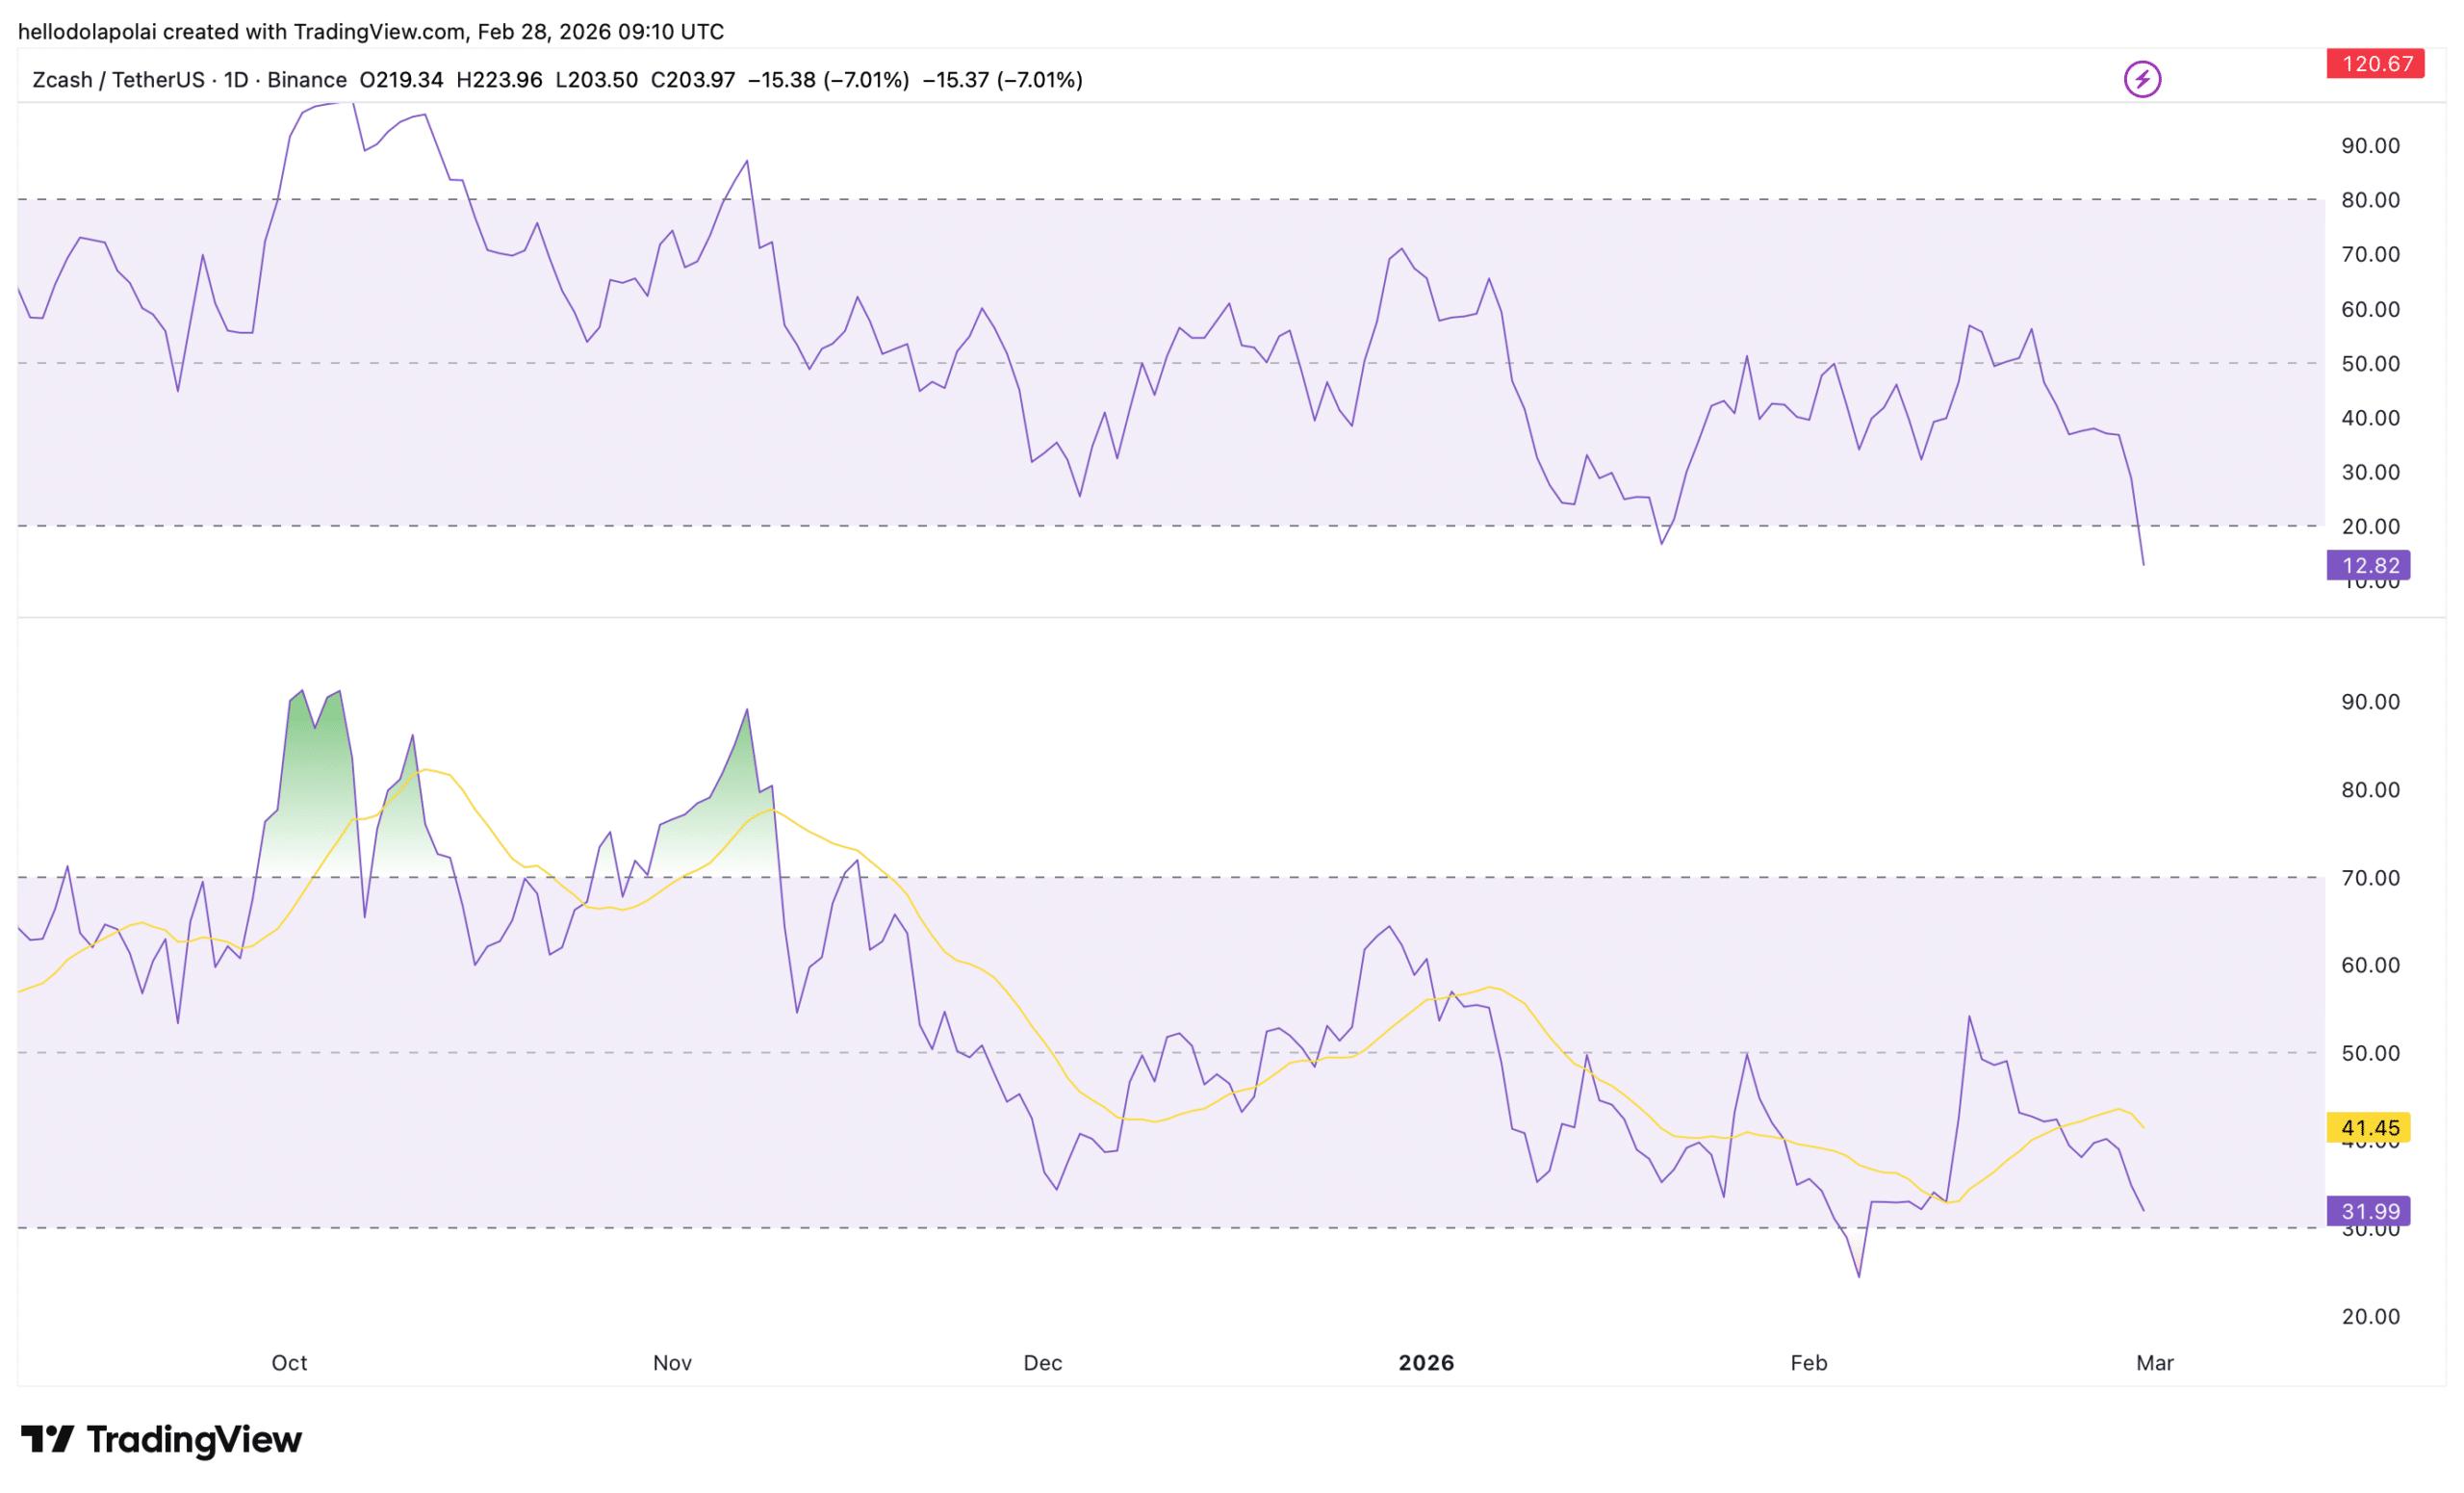
Source: TradingView
At the time of analysis, ZEC’s MFI has dropped to 18. While this level often indicates oversold conditions, where selling pressure may soon ease, it does not guarantee an immediate reversal. For now, investors remain cautious as the market shows no clear sign of accumulation.
Similarly, the Relative Strength Index (RSI), a momentum-based indicator, has fallen below the neutral 50 level and continues to trend lower. This decline suggests fading buying strength and confirms that bearish momentum still dominates the chart.
Where is ZEC heading?
The liquidation heatmap offers insight into potential short-term direction. Liquidity clusters sit above the current price, which could attract price action upward, as markets often gravitate toward areas with concentrated liquidity.
This setup supports the possibility of a short-term rebound. However, lower liquidity clusters also exist around $197. Price could dip slightly to sweep that liquidity before attempting a stronger rally toward higher clusters.

Source: CoinGlass
While the heatmap suggests room for upside movement, broader sentiment and momentum remain fragile. Until buyers reclaim key levels and indicators show sustained improvement, ZEC remains at risk of further downside pressure.
Final Summary
- Bulls are stepping aside at a time when price is clinging to a critical support level.
- The liquidation heatmap still points to a possible rebound, with liquidity clusters positioned above the current price.


