-
Ethereum price slides nearly 8%, breaking below the $2300 mark as selling pressure accelerates.
-
Over $280 million in ETH-related liquidations and rising exchange inflows suggest potential distribution rather than dip-buying.
Ethereum (ETH) entered the week under heavy pressure, falling nearly 8% today and slipping decisively below the $2300 level amid a broader crypto market selloff. The move unfolded quickly, with downside momentum accelerating as leveraged long positions were forced out and spot demand failed to stabilize prices. While on-chain behaviour shows capital moving toward exchanges rather than into long-term storage alongside the rising macro uncertainty suggest Ethereum price is facing more than a routine pullback, resembling that ETH may be entering a distribution phase.

On-Chain Flows Signal Elevated Distribution Risk
Ethereum’s downside was preceded by a notable shift in on-chain behavior, particularly among large holders. Exchange inflow data shows a sharp and synchronized increase in ETH deposits, a signal often associated with preparation for selling, hedging, or risk reduction. On February 1, inflows into Binance alone surged to roughly 357,000 ETH, marking the exchange’s highest daily inflow since September. At the same time, total inflows across all major exchanges approached 600,000 ETH, one of the largest coordinated spikes seen in recent months.
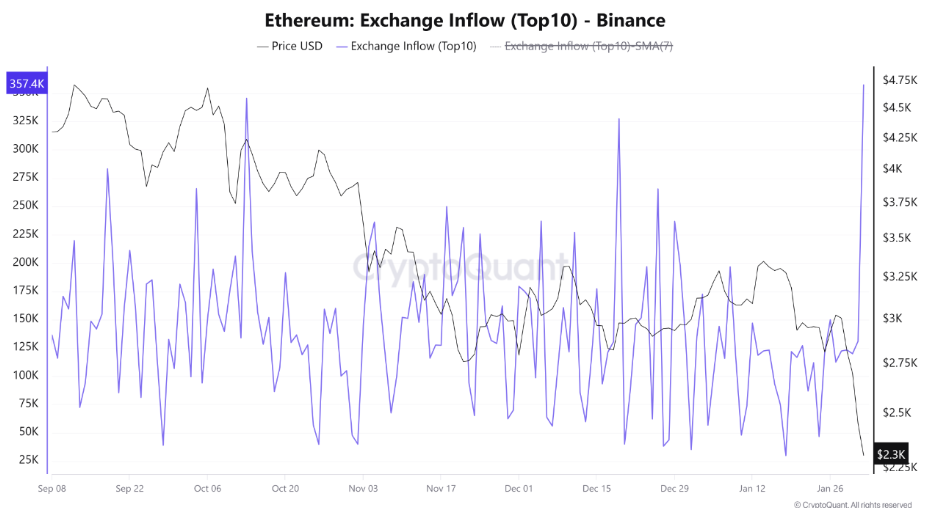
Such concentrated inflows rarely appear during periods of strong accumulation. Instead, they tend to surface when large holders reposition exposure near key price levels. The timing of this inflow surge just ahead of ETH’s breakdown below $2,300, significantly increased the market’s sensitivity to downside moves. Combined with rising leverage, these inflows reduced the market’s ability to absorb selling pressure, amplifying the liquidation cascade once price began to slide.
Liquidation Pressure Builds as Leverage Unwinds Aggressively
Derivatives data shows Ethereum at the center of the latest liquidation wave. Over the past 24 hours, ETH-related liquidations surged to approximately $280 million, surpassing Bitcoin’s $250 million and reinforcing Ethereum’s role as the primary stress point in the market.
The liquidation heatmap reveals that long positions dominated losses, confirming that bullish leverage had become overcrowded near recent consolidation highs.
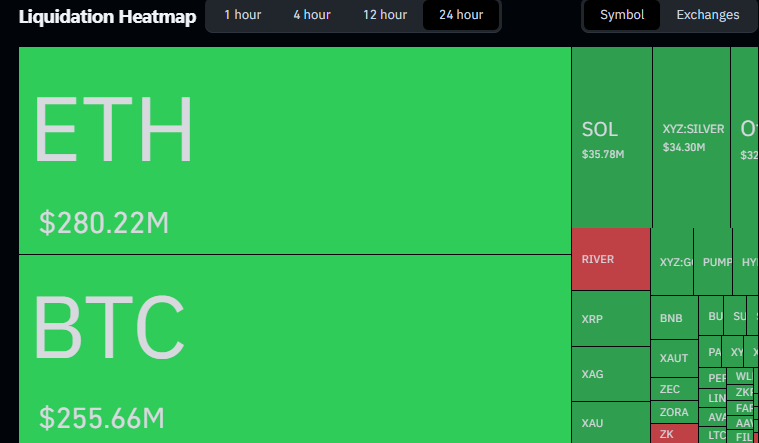
Once ETH slipped below short-term support, cascading stop-outs accelerated the move lower, pushing price swiftly through thin liquidity zones. This pattern reflects structural weakness rather than panic selling. When liquidations cluster this tightly, price movements tend to overshoot fair value before stability returns, leaving Ethereum vulnerable to additional volatility in the near term.
Ethereum Price Structure Weakens Below Key Support
Ethereum’s recent breakdown below the support zone of $2500 carries meaningful implications. The loss of the $2300-$2500 support level invalidated the prior consolidation structure and shifted market control firmly toward sellers. Ethereum price is now trading below its short-term moving averages, with momentum indicators pointing lower rather than stabilizing.
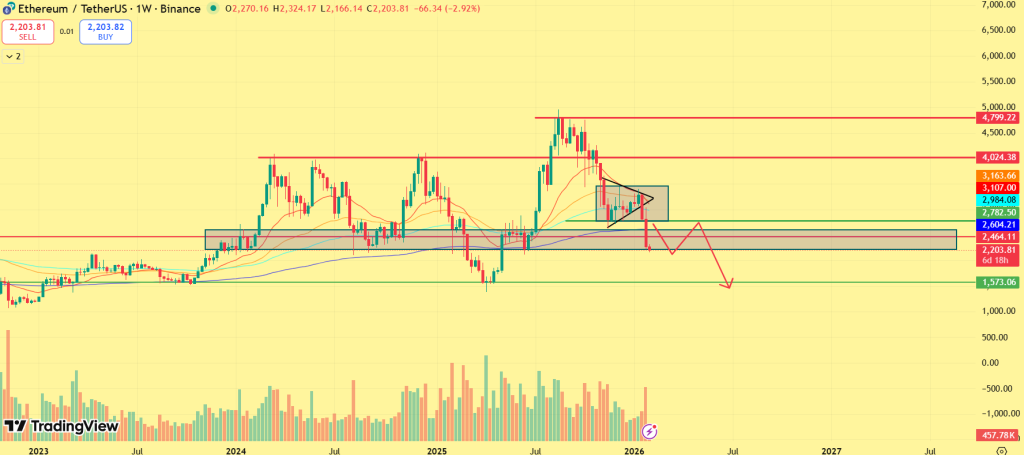
The absence of strong buying volume on the way down further suggests that demand remains cautious rather than aggressive. The immediate support sits near $2000, which if breaks a major decline toward $1600 could be seen next.
Is the Worst of the ETH Selloff Already Priced In?
Despite the ongoing selloff, Ethereum’s higher-timeframe structure is beginning to hint at a potential inverse head-and-shoulders formation. The structure formed after ETH’s slide toward the $2100-$2500 zone, where selling momentum started to fade and volume failed to expand on fresh lows. Recent price action suggests a right shoulder may be developing, indicating stabilization rather than going lower.
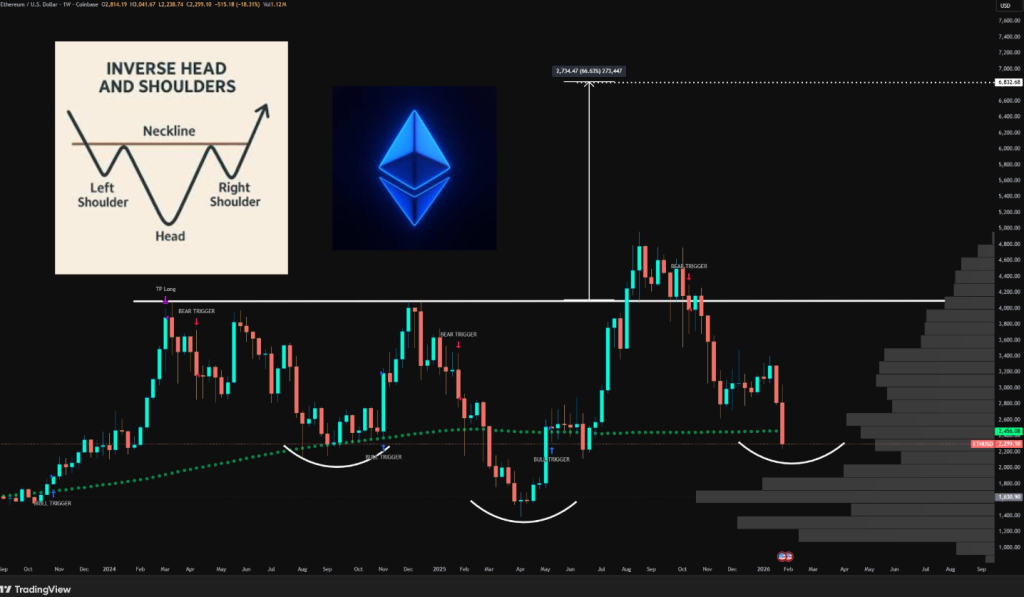
This reversal scenario gains credibility only if ETH price reclaims the $2500 neckline on strong volume. Until then, the pattern remains conditional, with a loss of $2100 invalidating the setup and restoring downside risk. A period of consolidation or a technical relief bounce cannot be ruled out if ETH holds its current demand zone. Until reclaim levels are decisively broken, the broader outlook stays cautious, with volatility likely to remain elevated.
FAQs
Ethereum is dropping due to rising exchange inflows, leveraged long liquidations, and weak buying amid broader crypto market pressure.
Over $280 million in ETH long positions were liquidated in the last 24 hours, highlighting market stress and weak support.
A potential inverse head-and-shoulders pattern suggests stabilization, but ETH must reclaim $2500 on strong volume to confirm.