Date: Wed, Nov 26, 2025 | 09:10 AM GMT
The broader cryptocurrency market is showing signs of recovery after last week’s intense volatility, which dragged Ethereum (ETH) as low as $2622 before bouncing back above $2900. While many altcoins have shifted into green territory, privacy-focused token Zcash (ZEC) remains under pressure.
The asset has logged a sharp 16% decline over the past week, driven by a key technical breakdown that now suggests more downside may be on the horizon.
 Source: Coinmarketcap
Ascending Triangle Breakdown
On the 4-hour chart, ZEC had been trading within an ascending triangle — a typically bullish formation that favors upward continuation when buyers manage to break resistance with momentum. But after several failed attempts to clear the neckline around $716, bullish strength started fading.
The turning point came when ZEC broke below both the ascending trendline and the 100 moving average near $589. This triggered a wave of selling pressure, pulling the price sharply lower toward $469.69. From there, ZEC attempted for a retest.
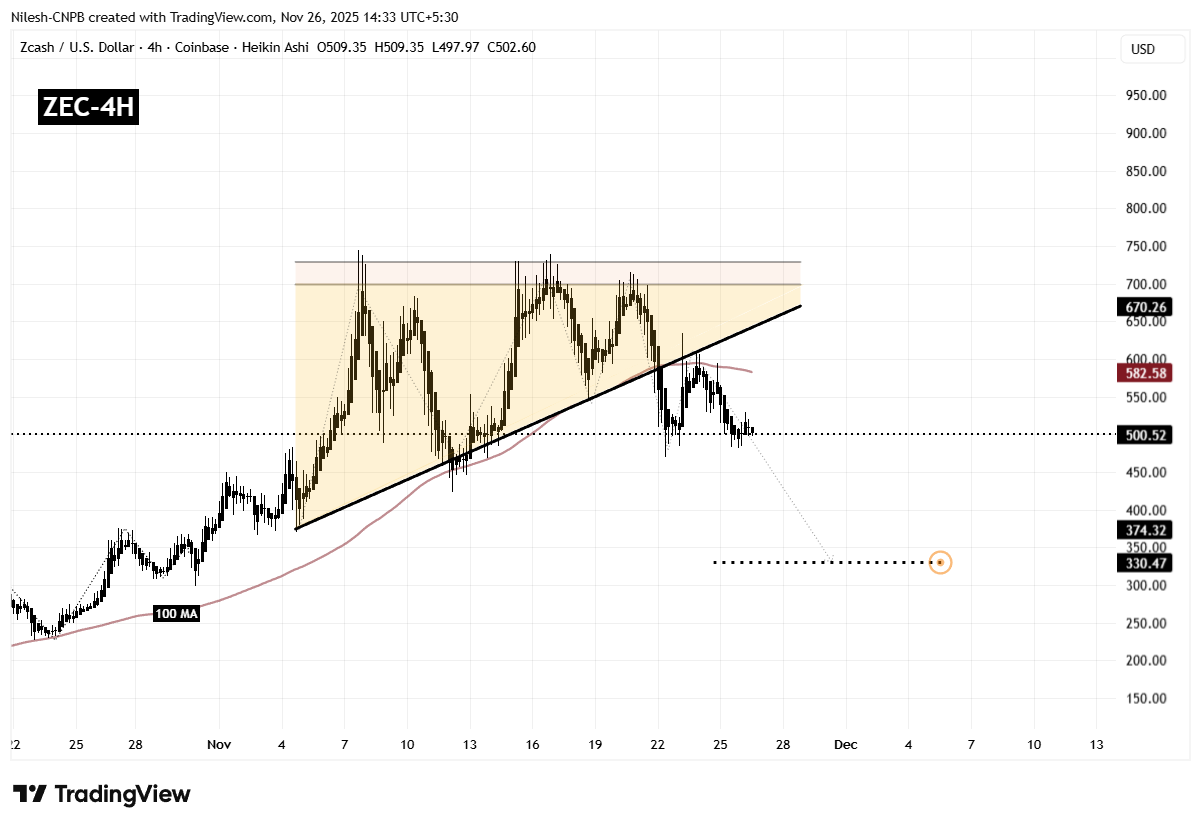 Zcash (ZEC) 4H Chart/Coinsprobe (Source: Tradingview)
The retest pushed the price back toward the breakdown trendline around $608, which aligned perfectly with the 100-period moving average. Sellers defended this zone firmly, rejecting the retest and sending ZEC lower once again. The asset has now slipped back to the $500 region, reinforcing the bearish continuation signal.
What’s Next for ZEC?
As long as ZEC trades below the neckline resistance and remains under the 100-MA barrier, the bears hold firm control. A breakdown below the recent swing level of $469.69 could accelerate momentum to the downside, exposing the next major support near $330.47 — which represents the measured target from the triangle structure.
On the other hand, if buyers unexpectedly reclaim strength and push ZEC back above the 100-MA, the bearish structure would weaken, allowing room for a temporary recovery phase. But for now, the chart continues to lean toward a deeper correction.