
Wintermute Outlook: Funding Inflow Stalls, Market Enters Stock Game Phase

Global liquidity remains ample, with funds just not flowing into the crypto market at the moment.
Original Title: Liquidity, the lifeblood of crypto
Original Source: Wintermute
Original Translation: Azuma, Odaily Planet Daily
Key Takeaways
1. Liquidity drives the market cycles of the crypto sector, with inflows from stablecoins, ETFs, and DATs (Digital Asset Treasuries) slowing down.
2. Global liquidity remains ample, but higher SOFR rates are keeping funds parked in short-term treasuries (T-bills) rather than flowing into the crypto market.
3. The crypto market is in a phase of "self-circulation" — funds are circulating internally until new external funds re-enter.
The Dominant Role of Liquidity
Liquidity often dictates the cyclical nature of each cryptocurrency market cycle. While adoption in the long run may shape the narrative of the cryptocurrency industry, what truly drives price changes is the direction of fund flows.
Over the past few months, the momentum of this fund flow has notably slowed down. Capital entering the ecosystem through the three main channels — stablecoins, ETFs, and Digital Asset Treasuries (DAT) — has seen its velocity synchronized weakening, shifting the crypto market from an expansion phase to a stock fund-supported phase.
While technological adoption is crucial, liquidity is the key driver behind the market's cyclical shifts. It is not just a matter of market depth but also of fund availability. When global monetary supply expands or real interest rates decline, excess liquidity will inevitably seek risk assets, with crypto assets historically (especially during the 2021 cycle) being among the largest beneficiaries.
In previous cycles, liquidity primarily entered digital assets through stablecoin issuance, which is the most fundamental fiat on-ramp. As the market matures, three major liquidity funnels have gradually emerged, determining the path for new capital to enter the crypto market:
· Digital Asset Treasuries (DATs): Tokenized funds with yield structures, used to bridge traditional assets with on-chain liquidity.
· Stablecoins: On-chain forms of fiat liquidity, serving as the base collateral for leverage and trading activity.
· ETF: Provides a BTC and ETH exposure channel for traditional financial institutions and passive funds.
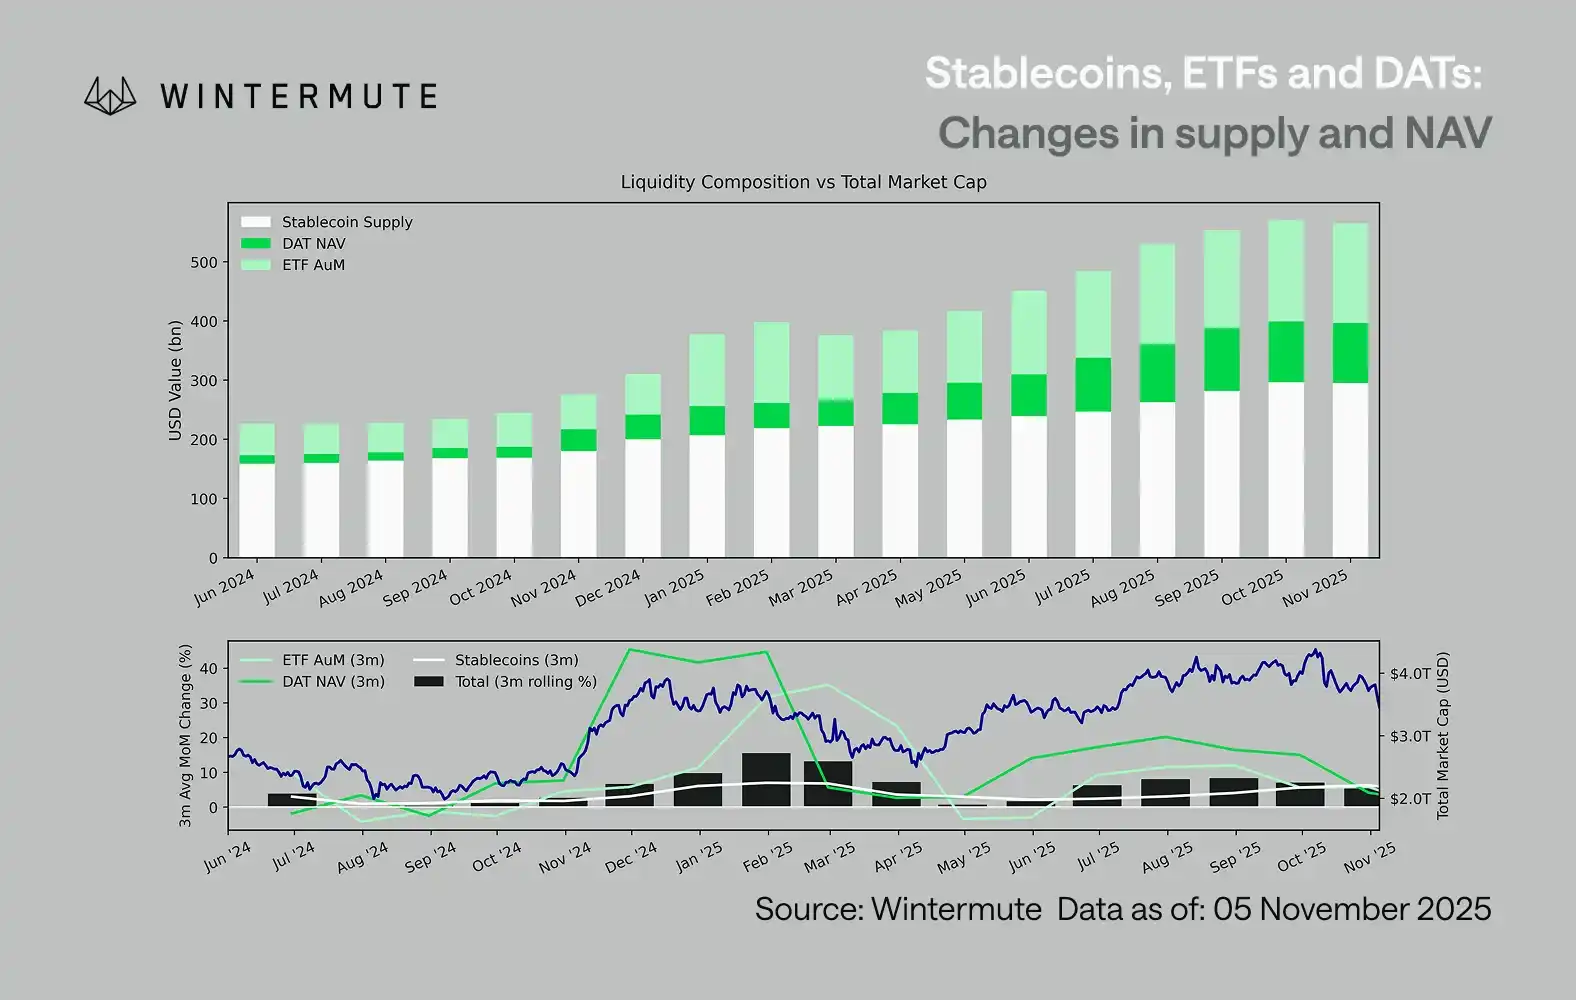
Combining the ETF's Assets Under Management (AUM), the DAT's Net Asset Value (NAV), and the circulating supply of stablecoins can serve as a reasonable metric to gauge the inflow of total digital asset capital.
The chart below illustrates the changes in these components over the past 18 months. The bottom chart demonstrates that the variation in this total amount is highly correlated with the overall digital asset market capitalization—when inflows accelerate, prices also rise.
Which inflow path has slowed down?
An important insight reflected in the chart is that the momentum of inflows into DAT and ETF has significantly weakened. These two paths showed strong performance in the fourth quarter of 2024 and the first quarter of 2025, experienced a brief recovery in early summer, but the momentum has gradually dissipated since. Liquidity (M2) is no longer naturally flowing into the crypto ecosystem as it did at the beginning of the year. Since early 2024, the combined size of DAT and ETF has increased from around $400 billion to $2.7 trillion, while stablecoin supply has doubled from about $1.4 trillion to $2.9 trillion. This demonstrates structural growth but also indicates a clear "plateau."
Observing the deceleration pace of different paths is crucial as each path reflects distinct sources of liquidity: Stablecoins reflect the native risk appetite of the crypto market; DAT embodies institutional demand for yield assets; and ETFs map the allocation trend of traditional financial funds; with all three slowing down simultaneously, it suggests that new capital deployment is universally decelerating, not just rotating between products.
Stockpile Game Market
Liquidity has not vanished; it is merely circulating within the system, rather than expanding continuously.
From a broader macro perspective, overall economic liquidity (M2) outside the crypto market has not stalled. While higher SOFR rates may temporarily constrain liquidity—making cash returns more attractive, keeping funds in the treasury market—the world is still in an accommodative phase, and the U.S. quantitative tightening (QT) has officially ended. The structural backdrop remains supportive; it's just that liquidity is currently flowing more toward other risk expression forms, such as the stock market.
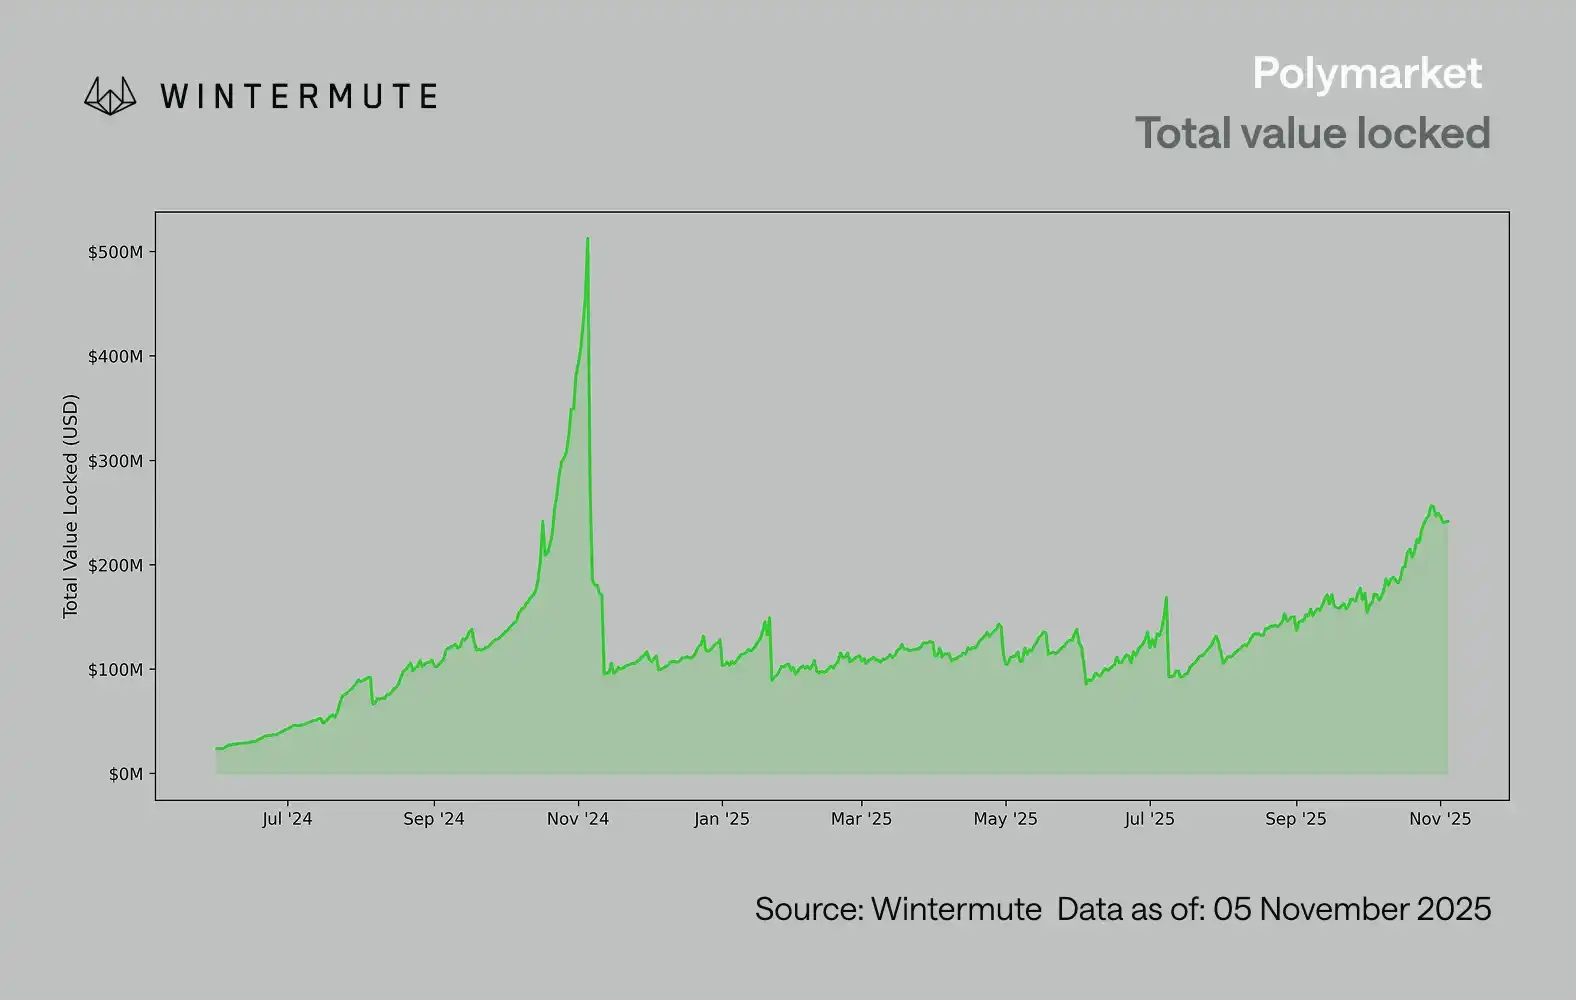
Due to a decrease in external funding inflows, the market dynamics have become more closed-off. Funds mostly rotate between large-cap coins and altcoins, creating an environment of internal PvP (player versus player). This explains why bull market rallies are always short-lived and why market breadth continues to narrow even when the total asset under management remains stable. Currently, the surge in market volatility is primarily driven by a cascade of liquidations rather than sustained trend-following.
Looking ahead, if any of the liquidity pathways see a substantial recovery — whether it's a resurgence in stablecoin minting, a renewed interest in ETFs, or a rebound in DeFi Activity Token (DAT) volume — it would signify that macro liquidity is flowing back into the digital asset space.
Until then, the crypto market will remain in a "self-sustaining" phase where funds circulate internally rather than compounding growth.
Disclaimer: The content of this article solely reflects the author's opinion and does not represent the platform in any capacity. This article is not intended to serve as a reference for making investment decisions.
You may also like
The AI boom may follow the path of the 19th-century railway bubble, and builders may not be the ultimate winners
Goldman Sachs analyst Bobby Molavi compared the current situation to the 19th-century British railway mania: 500 companies spent more than the nation's annual income building 8,000 miles of railway, with most early investors losing out, while the real beneficiaries were the later "passengers." He pointed out that the current AI craze is driven by both debt and momentum, and that the S&P 500’s forward P/E ratio of 18x is only "a bit cheaper." Whether the builders can retain value is uncertain, and history does not offer an optimistic answer.

If Anthropic's IPO goes smoothly and the stock price rises next week, then everything remains the same for AI. Otherwise, some companies will go bankrupt.
The shrinking valuations of two major giants have triggered a chain reaction—investors are adopting more conservative revenue multiples for AI startups and are directly halting high-valuation financing for companies with zero revenue. Multiple venture capital firms have advised their portfolio companies to lower valuation expectations and to quickly build up cash reserves. Market participants warn that the outcome of Anthropic’s IPO will be a barometer for the industry: if successful, the boom will continue; if it fails, some companies may face elimination.
After the Brazilian election, political discount deepens; Morgan Stanley remains bullish on Petrobras (PBR.US), focusing on fuel pricing and dividends
Morgan Stanley still maintains its most optimistic "Overweight" rating, but has lowered its year-end 2027 target price from $31 to $25.

Corning (GLW.US) receives initial "Buy" rating from Jefferies! AI factories driving a fiber optic rush, with a potential global supply gap of up to 30%
For Corning, the recent profit growth mainly comes from the expansion of AI clusters. As the number of optical links crossing cabinets and campuses increases, customers need to deploy more optical fibers within limited conduit and cabinet space, thus driving demand for high-density optical cables and connection systems.

Crypto prices
More


