

Key Notes
- HBAR gains 3% in 24 hours, hitting $0.20 after ETF inflows surge.
- Canary’s HBAR ETF records $44 million in net inflows, leading altcoin peers.
- Falling wedge breakout pattern projects up to $0.50 if bullish momentum holds.
After closing October with a 13% loss, Hedera (HBAR) price dipped by another 3% in the last 24 hours, hitting $0.19 on November 2. As macro headwinds taper off, Hedera appears to be benefiting from $44 million ETF inflows, as institutional investors take on a bullish outlook on HBAR’s enterprise solution prospects.
Do Corporate Investors Prefer Hedera to Litecoin?
Canary’s HBAR ETF, trading on Nasdaq, was among the altcoin ETFs approved for trading on October 28, alongside Solana and Litecoin.
HBAR price surged to a 20-day peak of $0.21 during its listing day before retracing into the narrow range between $0.19 to $0.20. Historically, such major events often attract “sell-the-news” trades, as short-term speculators capitalize on the market euphoria to lock-in gain.
U.S. Federal Reserve Chair Jerome Powell further dampened risk-on momentum with recent comments downplaying expectations of a fourth rate cut in December and ongoing trade tensions with China.
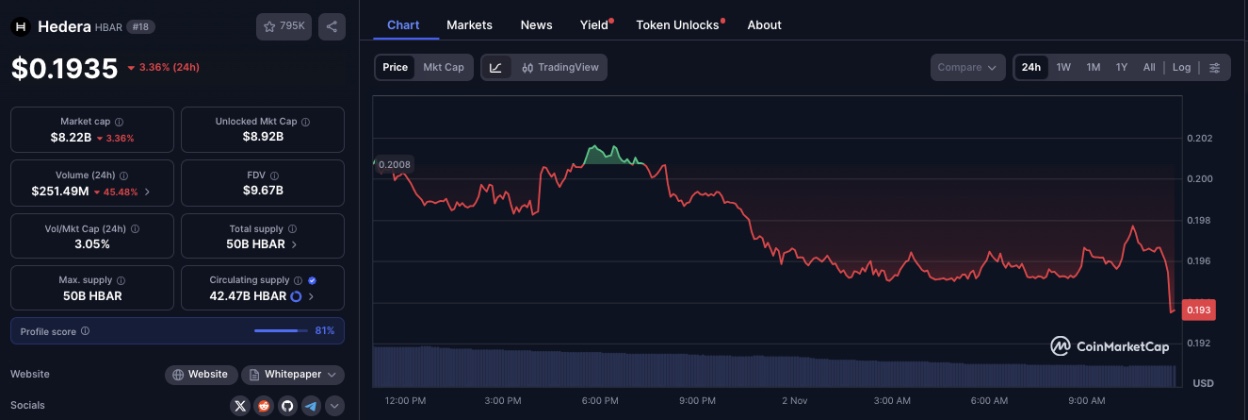
Hedera (HBAR) price hits $0.19 and $8B market cap on November 2, 2025 | Source: Coinmarketcap
However, data from SoSoValue shows that Canary’s HBAR ETF absorbed $44 million in total net inflows and amassed $45.93 million in net assets during its first trading week, from October 28 to October 31. In contrast, Litecoin’s ETF recorded a modest $719,970 in inflows and $1.64 million in assets.
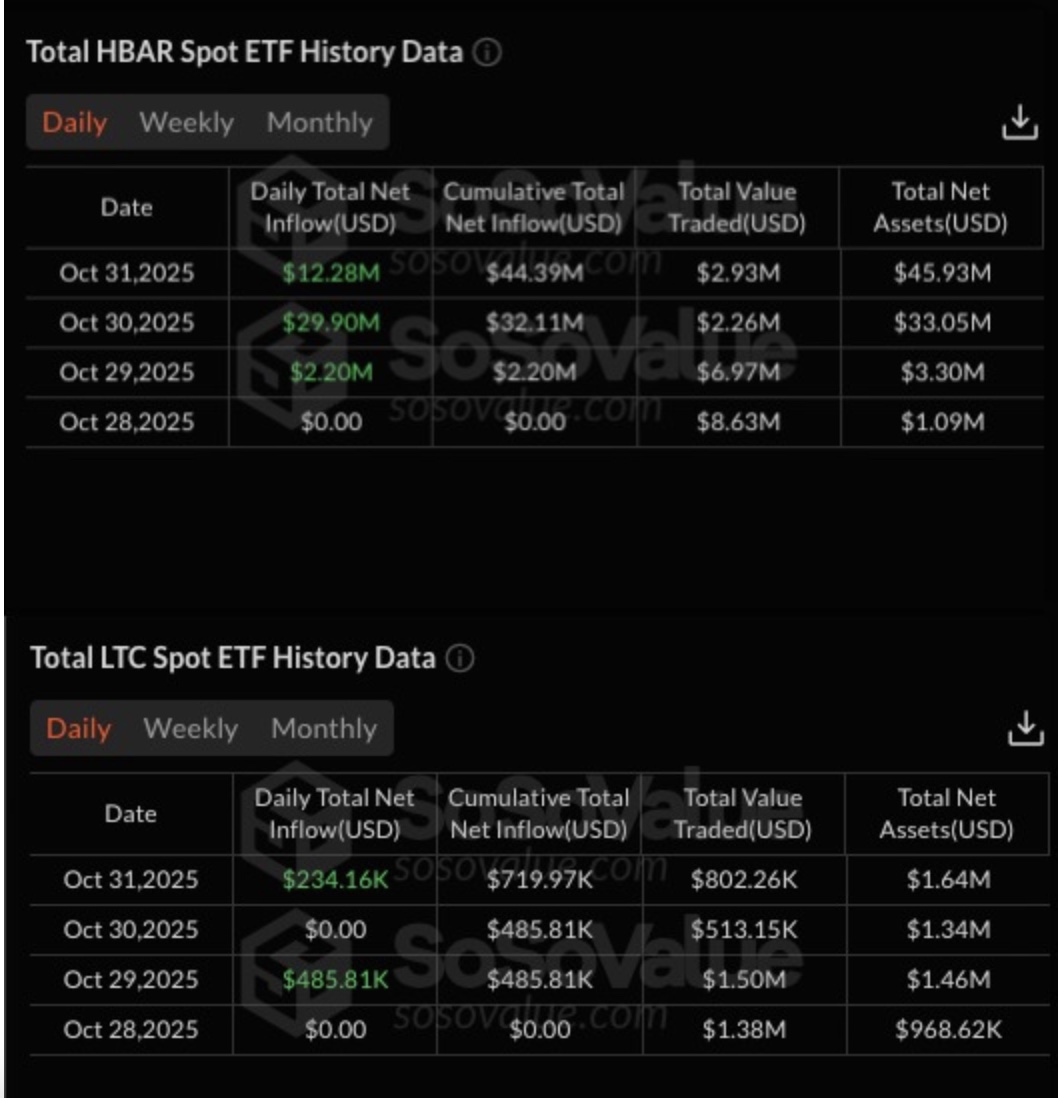
Canary’s (HBR) Hedera ETF ($44M) vs Litecoin (LTCC) ETF ($719,970) first week netflows | Source: SosoValue
The stark disparity in Canary’s LTCC and HBR inflows reflect clear institutional preference, expressing a more bullish outlook on Hedera’s enterprise solutions over Litecoin’s payments-based utility.
Hedera takes an “enterprise-first” approach by engineering its network architecture and governance model to meet the high demands and compliance needs of large organizations. Hedera has notched key partnerships and collaborations with regulators and government agencies, including the United States Department of Defense , and Qatar Financial Centre (QFC )
Meanwhile, Litecoin continues to gain traction in global payments, with gaming platform Stake.com now accounting for 16% of daily LTC transactions according to recent reports.
Despite Hedera’s 3% price dip on Sunday, its market capitalization sits at $8 billion, having leapfrogged Litecoin’s $7.8 billion to become the 19th largest cryptocurrency, according to Coinmarketcap data.
HBAR Price Forecast: Falling Wedge Pattern Projects $0.50 Target
Hedera’s price appears poised for a potential 150% breakout according to a falling wedge pattern signal on the HBAR/USDT daily chart.
As seen below HBAR price is consolidating just below a key wedge resistance near $0.21, with the broader structure stretching back to early February. A decisive breakout above this resistance could confirm a long-term bullish reversal, validating the pattern’s projected 150% upside target toward $0.50.
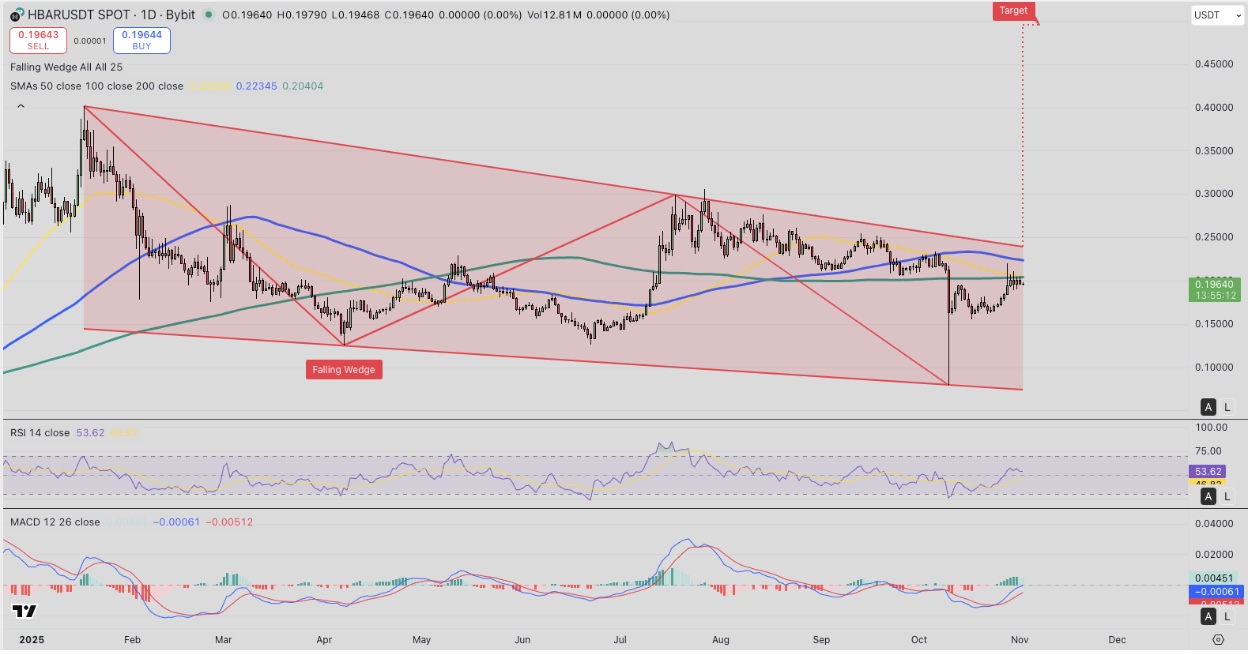
Hedera (HBAR) technical price analysis, Nov 2, 2025 | TradingView
The 50-day SMA (yellow) currently trends near $0.20, acting as short-term support, while the 100-day (blue) and 200-day SMA (green) rest around $0.22 and $0.20, forming a compressed consolidation zone. This clustering of moving averages signals imminent volatility when HBAR price breaks in either direction.
Momentum indicators lean bullish, with the MACD line having just crossed above the signal line, suggesting building bullish momentum. The Relative Strength Index (RSI) is trending downward to 53.6. Euphoria around the ETF approval verdict has cooled after recent profit-taking.
A decisive close above $0.21, which would validate a confirmed wedge breakout. Should this occur, analysts expect HBAR to target the $0.28 resistance first, followed by $0.35, before ultimately attempting to reach the pattern’s full extension near $0.50.
Conversely, failure to hold above the wedge’s mid-range support at $0.18, could expose HBAR to a pullback toward $0.15.
next




