Bitget App
Trade smarter
Buy cryptoMarketsTradeFuturesStocksEarnInstitutionAI & More
Aster (ASTER) Extends Its Decline — But This Bullish Fractal May Trigger a Rebound!

Aster (ASTER) Extends Its Decline — But This Bullish Fractal May Trigger a Rebound!

CoinsProbeCoinsProbe2025/10/22 18:03
By:Nilesh Hembade

Date: Wed, Oct 22, 2025 | 11:46 AM GMT

The cryptocurrency market continues to display its characteristic volatility, with Ethereum (ETH) trading in the red at the $3,825 level after a 6% weekly decline, reflecting choppy conditions that have added pressure on several major altcoins — including DEX token Aster (ASTER).

ASTER has dropped another 89 today, extending its weekly loss to 31%. However, beneath the heavy sell pressure, an interesting bullish fractal appears to be emerging — one that mirrors the earlier setup of Hyperliquid’s (HYPE) recovery structure. If ASTER follows a similar path, it could be setting the stage for a rebound.

Aster (ASTER) Extends Its Decline — But This Bullish Fractal May Trigger a Rebound! image 0 Source: Coinmarketcap

ASTER Mirrors HYPE’s Path

As shown in the chart, ASTER’s recent price action has started to look strikingly similar to HYPE’s structure from April 2025.

Back then, after hitting an all-time high of $35.37, HYPE entered a deep correction phase, forming a classic rounding bottom pattern. The token fell by about 73% from its peak before finding a bottom. Once it reclaimed its 50-day moving average (MA), momentum flipped bullish, leading to a neckline breakout that triggered a strong recovery rally.
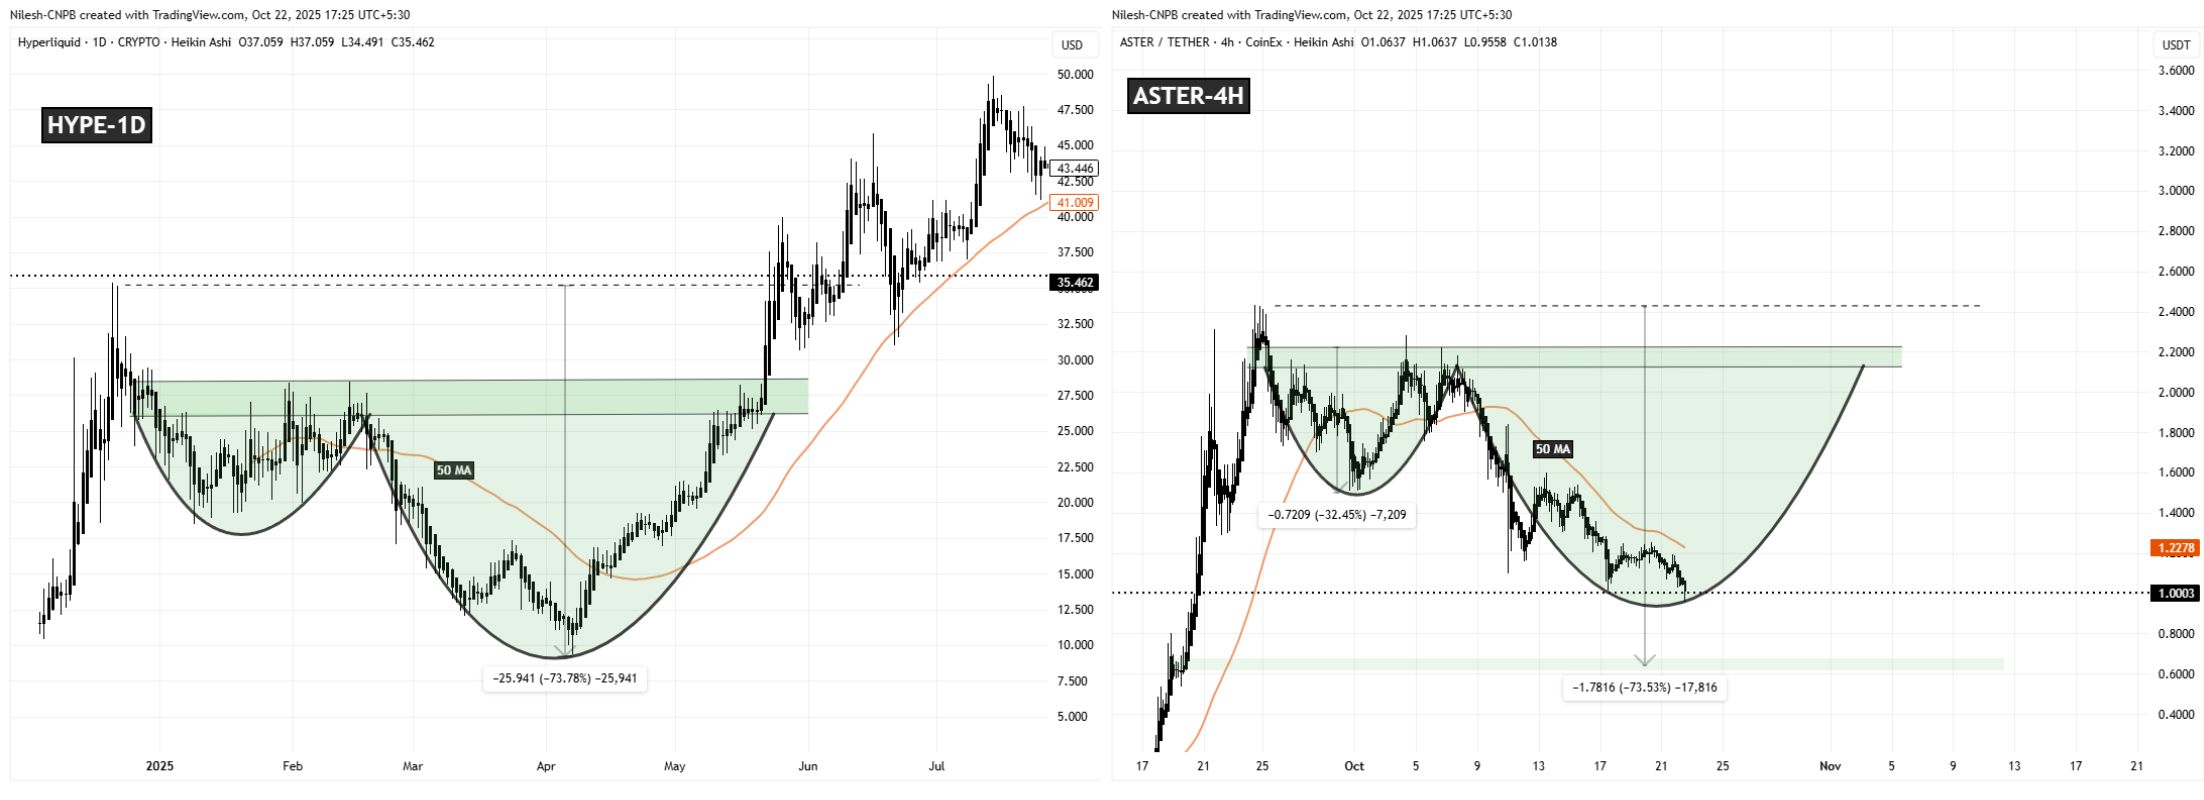
Aster (ASTER) Extends Its Decline — But This Bullish Fractal May Trigger a Rebound! image 1 HYPE and ASTER Fractal Chart/Coinsprobe (Source: Tradingview)

Now, ASTER seems to be tracing a nearly identical path. The token topped out at $2.43 before entering a sharp correction phase. It has since formed a similar rounded structure, currently hovering near the $1.00 zone, where a potential bottom could take shape — just as HYPE did before its reversal.

Adding to the fractal similarity, ASTER remains below its 50-hour MA resistance at $1.2278, a critical level that mirrors the setup seen in HYPE before its bullish breakout.

What’s Next for ASTER?

Technically, HYPE marked its bottom after a 73% decline from its all-time high. In comparison, ASTER has so far corrected about 59%, which suggests there may still be room for one final dip — possibly toward the $0.64 support zone — if the token fails to hold its current range of $0.98–$1.00.

However, if ASTER maintains its fractal similarity with HYPE, a reclaim of the 50-hour MA could shift momentum in favor of the bulls. That move could confirm the rounding bottom breakout, opening the door for a recovery phase and a potential trend reversal in the coming weeks.


0
0

Disclaimer: The content of this article solely reflects the author's opinion and does not represent the platform in any capacity. This article is not intended to serve as a reference for making investment decisions.

Understand the market, then trade.
Bitget offers one-stop trading for cryptocurrencies, stocks, and gold.
Trade now!

You may also like

CoreWeave's surge gives AI cloud a breather, now all eyes are on the Anthropic IPO and Nvidia

CoreWeave’s Q3 revenue and guidance both exceeded expectations, with its stock price surging 25% in a single day and the new cloud sector soaring over 12%. Reports of Anthropic’s potential $1.5 trillion IPO valuation, OpenAI’s quarterly revenue surpassing $10 billion for the first time, and these three positive catalysts together have boosted confidence in the AI computing power industry chain, which was previously troubled by doubts about AI returns. Next week’s Nvidia earnings report and Anthropic’s IPO will be the true test of whether this rally can continue.

华尔街见闻•2026/11/12 00:53
CoreWeave's surge gives AI cloud a breather, now all eyes are on the Anthropic IPO and Nvidia

AI Computing Power and Semiconductors Stage a Strong Rebound—Why Is Wall Street Cautious About U.S. Stocks? Key Indicators Reveal the Bottom Hasn't Been Reached

The sharp volatility in the US stock market has prompted investors to carefully analyze various data to determine whether the sell-off has ended. Early indicators suggest that it may be too soon to declare that the market has resumed its normal upward trajectory.

智通财经•2026/11/12 00:47
AI Computing Power and Semiconductors Stage a Strong Rebound—Why Is Wall Street Cautious About U.S. Stocks? Key Indicators Reveal the Bottom Hasn't Been Reached

Nvidia (NVDA.US) Governance Crisis Escalates: Jensen Huang Exposed for Another Affair, Board Considers Dismissal, and Wall Street Begins Pricing in a “No Jensen” Scenario

The world's most valuable semiconductor company is experiencing the most severe corporate governance crisis since its establishment.

智通财经•2026/11/12 00:32