Bitget App
Trade smarter
Buy cryptoMarketsTradeFuturesStocksEarnInstitutionAI & More
Aster (ASTER) To Surge Ahead? Key Harmonic Pattern Signals Potential Upside Move

Aster (ASTER) To Surge Ahead? Key Harmonic Pattern Signals Potential Upside Move

CoinsProbeCoinsProbe2025/10/18 13:12
By:Nilesh Hembade

Date: Sat, Oct 18, 2025 | 05:41 AM GMT

The cryptocurrency market continues to show choppy movement, as both Bitcoin (BTC) and Ethereum (ETH) have slipped by over 1.50% over the past 24 hours. This mild correction has rippled across the broader market, with total liquidations surpassing $900 million — of which around $627 million came from long positions.

Following the broader trend, Aster (ASTER) has also seen a 6% decline today. However, beneath the surface of this bearish pressure, the chart is hinting at a potential bullish reversal, thanks to the emergence of a harmonic pattern that could signal an upcoming upside move.

Aster (ASTER) To Surge Ahead? Key Harmonic Pattern Signals Potential Upside Move image 0 Source: Coinmarketcap

Harmonic Pattern Hints at Potential Upside

On the 4-hour chart, Aster appears to be completing a Bullish Butterfly harmonic pattern — a formation that often marks the end of a downtrend and the beginning of a fresh upward move.

The pattern started with an initial leg from Point X around $1.1573, followed by a strong rise to Point A, a pullback to Point B, a rebound to Point C, and finally, a decline to Point D near $1.0142 — where the potential reversal zone (PRZ) seems to be forming.
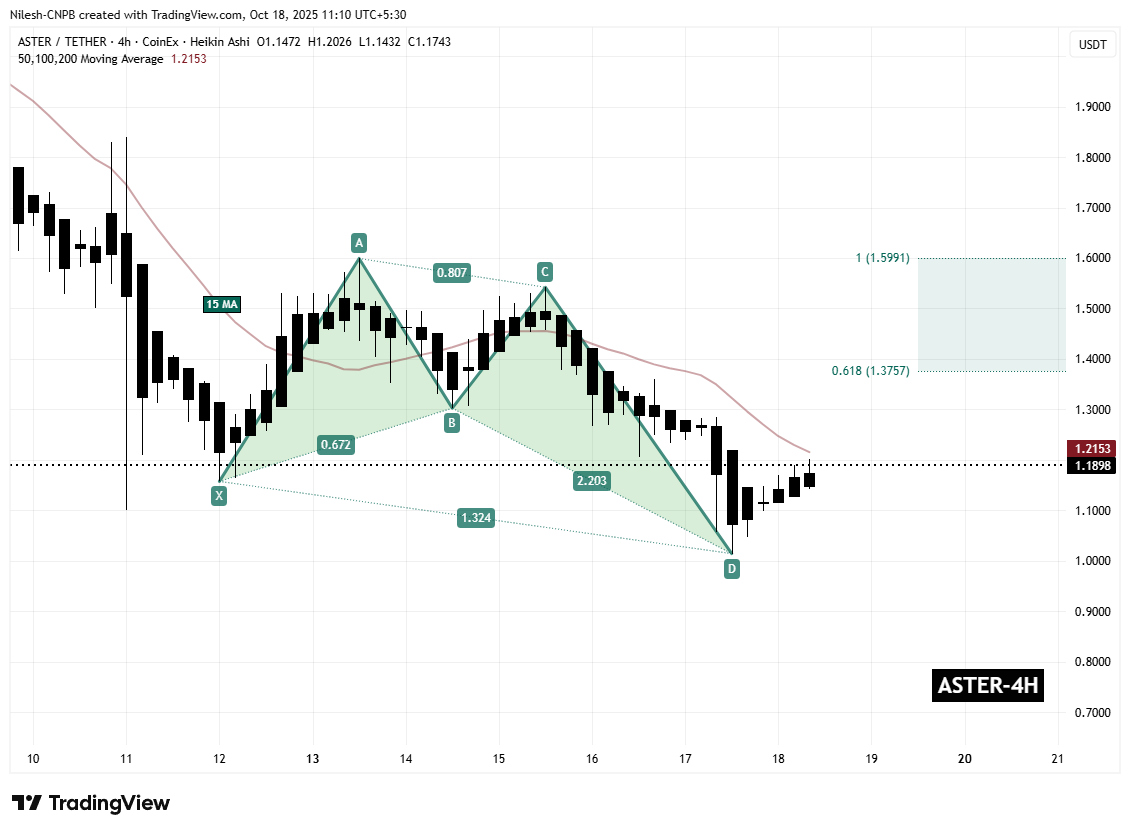
Aster (ASTER) To Surge Ahead? Key Harmonic Pattern Signals Potential Upside Move image 1 Aster (ASTER) 4H Chart/Coinsprobe (Source: Tradingview)

Since hitting that level, ASTER has shown early signs of recovery, currently trading around $1.19. What’s worth watching now is the 15-hour moving average (MA), which sits around $1.2153 — a crucial short-term resistance zone that could determine whether ASTER’s rebound gathers momentum or stalls.

What’s Next for ASTER?

If Aster manages to break above the 15-hour MA with increasing buying volume, the Bullish Butterfly pattern projects potential upside targets between $1.3757 (0.618 Fibonacci extension of the CD leg) and $1.5991 (1.0 Fibonacci extension).

These zones often act as the final stage of the Butterfly formation — where traders may take profits or the market may consolidate before deciding its next direction.

However, the bullish scenario remains valid only if ASTER holds above the D-point support near $1.01. A confirmed breakdown below this level would invalidate the harmonic setup and potentially extend the downside before any meaningful recovery takes place


0
0

Disclaimer: The content of this article solely reflects the author's opinion and does not represent the platform in any capacity. This article is not intended to serve as a reference for making investment decisions.

Understand the market, then trade.
Bitget offers one-stop trading for cryptocurrencies, stocks, and gold.
Trade now!

You may also like

Wall Street giants collectively raise rate hike forecasts, US Treasury futures continue to fall, gold drops over 1% to break 4000

After the US October CPI exceeded expectations, Goldman Sachs and Nomura added a forecast for an interest rate hike in March next year, while Deutsche Bank included a forecast for a rate hike in January next year. Currently, the market has fully priced in a 25 basis point rate hike in December, with a 13% probability for a 50 basis point hike. On Wednesday, the US Treasury spot market was closed, but Treasury futures continued to fall, with corresponding yields rising by about 2 to 4 basis points, and spot gold came under pressure, dropping by 1.1%.

华尔街见闻•2026/11/11 21:18
Wall Street giants collectively raise rate hike forecasts, US Treasury futures continue to fall, gold drops over 1% to break 4000

No Need to Worry About the Cooling Down of AI Data Center Construction? The US Import Boom Is Unlikely to Subside in the Short Term, Real Impact May Come in 2029

It takes an average of 4.8 years from finalizing investment to starting construction of a data center project, and an additional 2.6 years from construction start to becoming operational. Servers usually cannot be installed until after the building structure and racks are completed. For trade partners such as Taiwan (China), South Korea, and Mexico who rely on US data center supply chain demand, the inertia in construction timelines provides at least a one- to two-year buffer for future exports.

华尔街见闻•2026/11/11 21:18
No Need to Worry About the Cooling Down of AI Data Center Construction? The US Import Boom Is Unlikely to Subside in the Short Term, Real Impact May Come in 2029
