Bitget App
Trade smarter
Buy cryptoMarketsTradeFuturesStocksEarnInstitutionAI & More
Is Solana (SOL) Gearing Up For a Rebound? This Bullish Fractal Setup Saying Yes!

Is Solana (SOL) Gearing Up For a Rebound? This Bullish Fractal Setup Saying Yes!

CoinsProbeCoinsProbe2025/10/16 22:48
By:Nilesh Hembade

Date: Thu, Oct 16, 2025 | 05:25 PM GMT

The cryptocurrency market is struggling to stage a meaningful V-shaped recovery after the October 10 crash, which triggered over $19 billion in liquidations. Ethereum (ETH) continues to trade choppy, adding further pressure on major altcoins , including Solana (SOL).

SOL is currently trading in red with a 12% weekly drop, but beyond the short-term weakness, its technical structure is beginning to resemble a key bullish fractal seen earlier in Bitcoin’s (BTC) chart — a pattern that previously signaled a major rebound.

Is Solana (SOL) Gearing Up For a Rebound? This Bullish Fractal Setup Saying Yes! image 0 Source: Coinmarketcap

SOL Mirrors BTC’s Past Price Behavior

According to our ongoing fractal chart analysis, SOL’s current price structure and correction phase closely mirror Bitcoin’s late 2024 cycle.

Back in September 2024, BTC went through three consecutive corrections of roughly 25%, 29%, and 24%, before breaking out from its descending resistance trendline and reclaiming both the 50-day and 100-day moving averages. This breakout (marked in the chart’s green circle) triggered a strong 80% rally, taking Bitcoin into a sustained bullish phase.
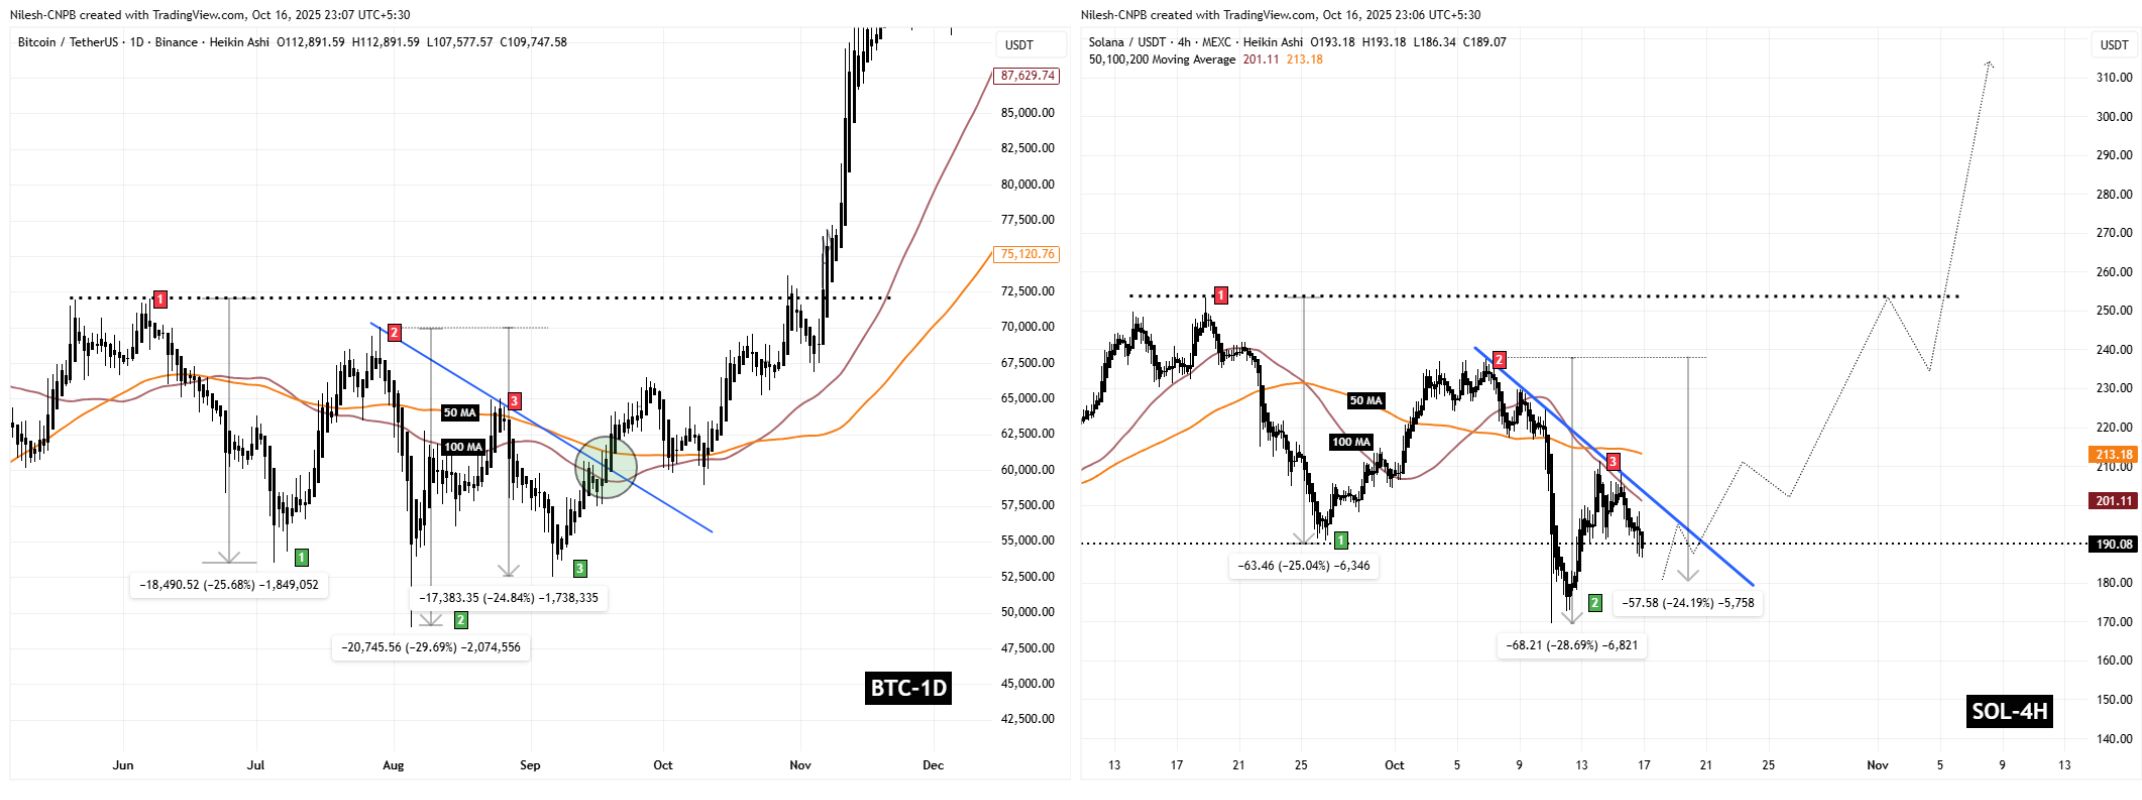
Is Solana (SOL) Gearing Up For a Rebound? This Bullish Fractal Setup Saying Yes! image 1 BTC and SOL Fractal Chart/Coinsprobe (Source: Tradingview)

Now, fast-forward to October 2025, Solana appears to be following the same path. After completing two major corrections — 25% and 28%, almost identical to BTC’s — SOL is now in the midst of its third and possibly final correction, trading below its descending resistance and key moving averages (50 MA and 100 MA).

What’s Next for SOL?

If the BTC fractal continues to guide this setup, SOL may experience one more minor leg down toward the $180 region, which would align with BTC’s final 24% dip before its breakout phase.

Once this correction phase completes, a potential rebound could take shape. A confirmed breakout above the descending resistance line and key moving averages could trigger a bullish rally, with targets pointing toward the $350 zone — mirroring the scale of BTC’s 80% rebound move.

However, it’s important to remember that fractals aren’t guaranteed. They often highlight historical symmetry but don’t ensure identical outcomes. Still, given the technical alignment and market structure, this setup is one to keep a close eye on in the coming days.


0
0

Disclaimer: The content of this article solely reflects the author's opinion and does not represent the platform in any capacity. This article is not intended to serve as a reference for making investment decisions.

Understand the market, then trade.
Bitget offers one-stop trading for cryptocurrencies, stocks, and gold.
Trade now!

You may also like

Wall Street giants collectively raise rate hike forecasts, US Treasury futures continue to fall, gold drops over 1% to break 4000

After the US October CPI exceeded expectations, Goldman Sachs and Nomura added a forecast for an interest rate hike in March next year, while Deutsche Bank included a forecast for a rate hike in January next year. Currently, the market has fully priced in a 25 basis point rate hike in December, with a 13% probability for a 50 basis point hike. On Wednesday, the US Treasury spot market was closed, but Treasury futures continued to fall, with corresponding yields rising by about 2 to 4 basis points, and spot gold came under pressure, dropping by 1.1%.

华尔街见闻•2026/11/11 21:18
Wall Street giants collectively raise rate hike forecasts, US Treasury futures continue to fall, gold drops over 1% to break 4000

No Need to Worry About the Cooling Down of AI Data Center Construction? The US Import Boom Is Unlikely to Subside in the Short Term, Real Impact May Come in 2029

It takes an average of 4.8 years from finalizing investment to starting construction of a data center project, and an additional 2.6 years from construction start to becoming operational. Servers usually cannot be installed until after the building structure and racks are completed. For trade partners such as Taiwan (China), South Korea, and Mexico who rely on US data center supply chain demand, the inertia in construction timelines provides at least a one- to two-year buffer for future exports.

华尔街见闻•2026/11/11 21:18
No Need to Worry About the Cooling Down of AI Data Center Construction? The US Import Boom Is Unlikely to Subside in the Short Term, Real Impact May Come in 2029
