
The Key to the Bear-to-Bull Transition: The Second S-Curve of Growth

The second S-curve of growth is the result of structurally normalizing finance under real-world constraints through yield, labor force, and credibility.
The second S-curve is the result of structurally normalizing finance through yield, labor, and credibility under real-world constraints.
Written by: arndxt
Translated by: AididiaoJP, Foresight News
Liquidity expansion remains the dominant macro narrative.
Recession signals are lagging, and structural inflation is sticky.
Policy rates are above neutral but below the tightening threshold.
The market is pricing in a soft landing, but the real adjustment is institutional: from cheap liquidity to disciplined productivity.
The second curve is not cyclical.
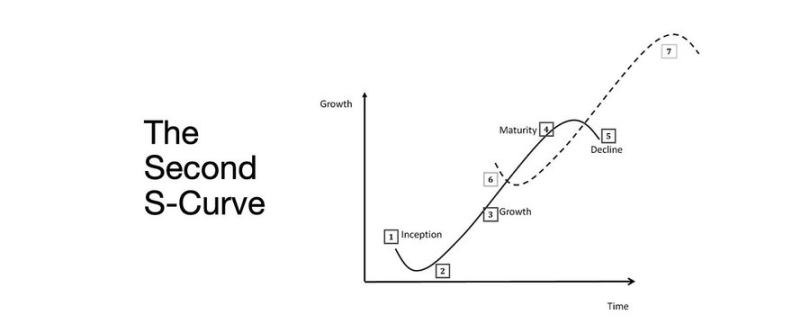
It structurally normalizes finance through yield, labor, and credibility under real-world constraints.
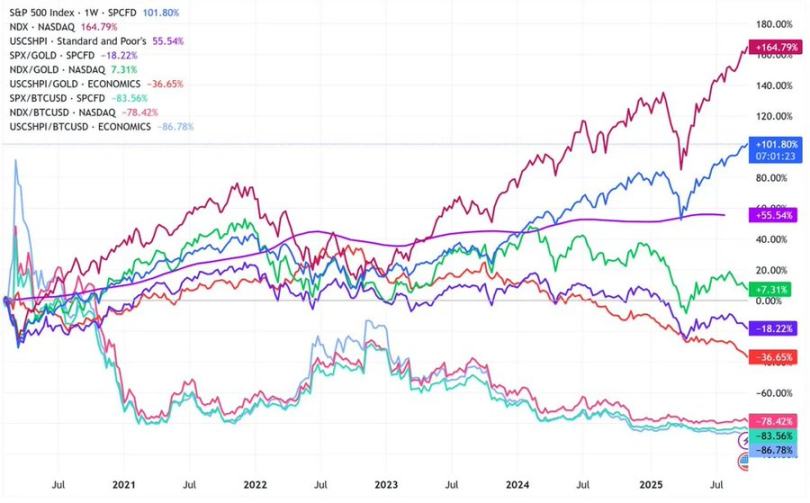
Cycle Transition
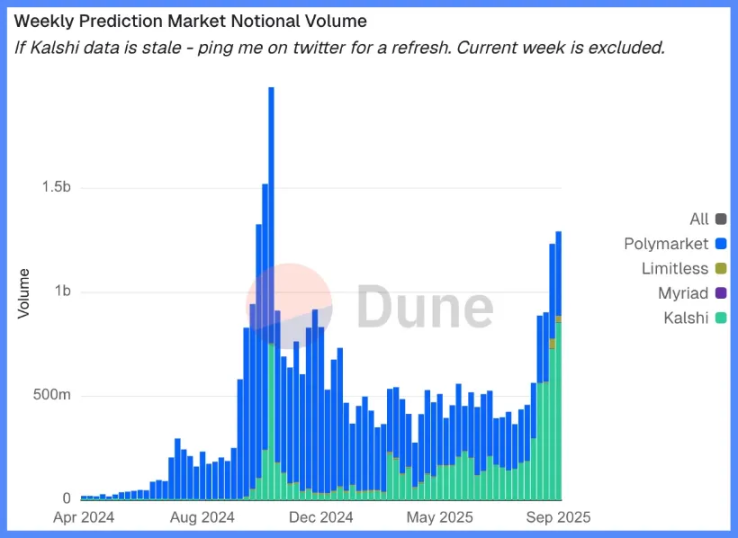
The Token2049 Singapore conference marked a turning point from speculative expansion to structural integration.
The market is repricing risk, shifting from narrative-driven liquidity to yield data supported by income.
Key shifts:
- Perpetual decentralized exchanges remain dominant, with Hyperliquid ensuring network-scale liquidity.
- Prediction markets are emerging as functional derivatives of information flow.
- AI-related protocols with real Web2 application scenarios are quietly expanding their revenues.
- Restaking and DAT have peaked; liquidity fragmentation is evident.
Macro Institutions: Currency Depreciation, Demographics, Liquidity
Asset inflation reflects currency depreciation, not organic growth.
When liquidity expands, duration assets outperform the broader market.
When liquidity contracts, leverage and valuations are compressed.
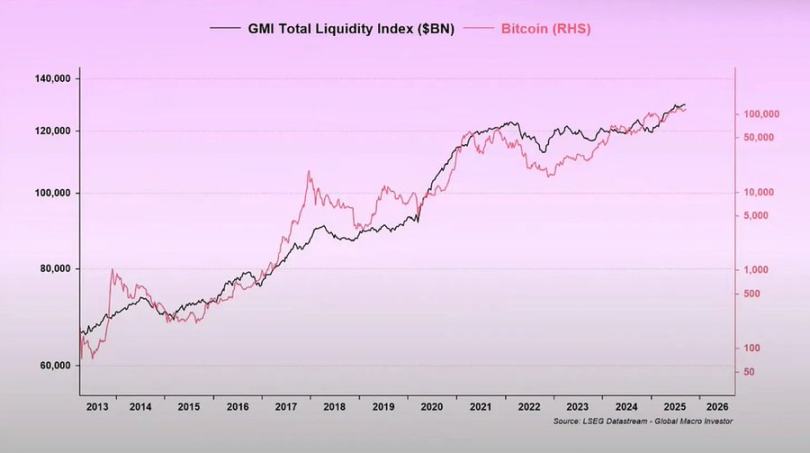
Three structural drivers:
- Currency depreciation: Repaying sovereign debt requires ongoing balance sheet expansion.
- Demographics: An aging population reduces productivity and reinforces dependence on liquidity.
- Liquidity pipelines: Since 2009, global total liquidity—defined as the sum of central bank and banking system reserves—has tracked 90% of risk asset performance.
Recession Risk: Lagging Data, Leading Signals
Mainstream recession indicators are lagging.
CPI, unemployment rate, and the Sahm Rule only confirm after an economic downturn has begun.
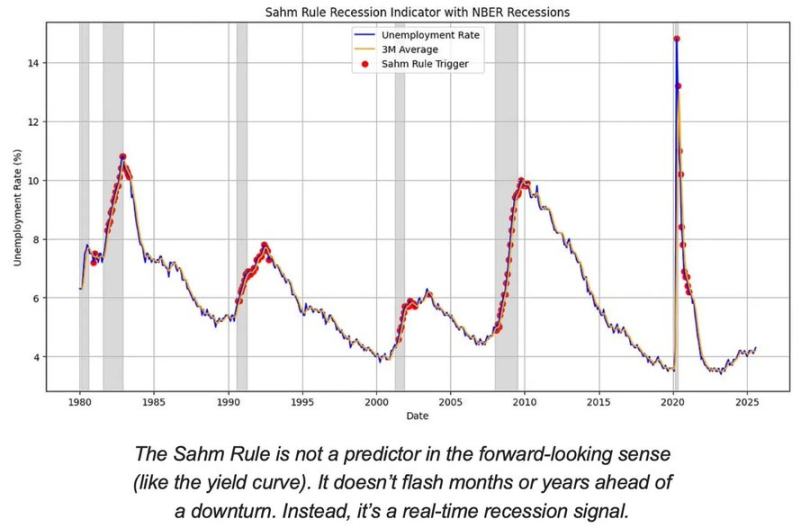
The US is in the late stage of the economic cycle, not in a recession.
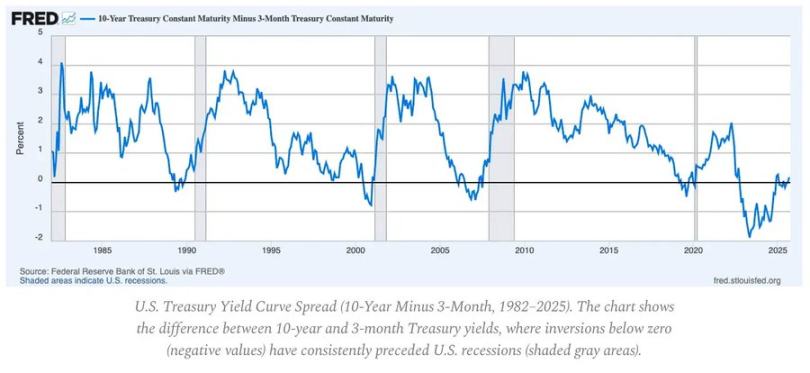
The probability of a soft landing remains higher than the risk of a hard landing, but policy timing is a constraint.
Leading indicators:
- The inverted yield curve remains the clearest leading signal.
- Credit spreads are under control, indicating no imminent systemic stress.
- The labor market is gradually cooling; employment remains tight within the cycle.
Inflation Dynamics: The Last Mile Problem
Goods disinflation is complete; services inflation and wage stickiness now anchor overall CPI near 3%.
This "last mile" is the most complex phase of disinflation since the 1980s.
- Goods deflation now offsets part of the CPI impact.
- Wage growth near 4% keeps services inflation elevated.
- Housing inflation is lagging in measurement; actual market rents have already cooled.
Policy implications:
- The Federal Reserve faces a trade-off between credibility and growth.
- Cutting rates too early risks re-acceleration; keeping them high for too long risks overtightening.
- The equilibrium outcome is a new inflation floor near 3%, rather than 2%.
Macro Structure
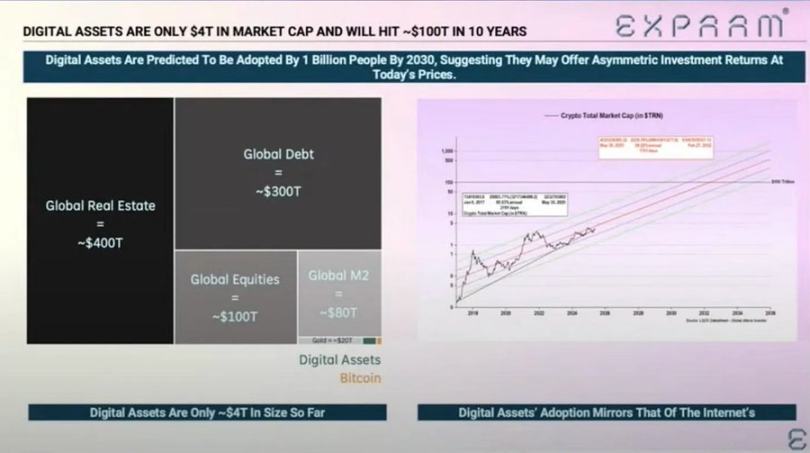
Three long-term inflation anchors remain:
- De-globalization: Supply chain diversification increases transformation costs.
- Energy transition: Capital-intensive low-carbon activities raise short-term input costs.
- Demographics: Structural labor shortages create persistent wage rigidity.
These limit the Federal Reserve's ability to normalize without higher nominal growth or a higher equilibrium inflation rate.
Disclaimer: The content of this article solely reflects the author's opinion and does not represent the platform in any capacity. This article is not intended to serve as a reference for making investment decisions.
You may also like

Wall Street giants collectively raise rate hike forecasts, US Treasury futures continue to fall, gold drops over 1% to break 4000
After the US October CPI exceeded expectations, Goldman Sachs and Nomura added a forecast for an interest rate hike in March next year, while Deutsche Bank included a forecast for a rate hike in January next year. Currently, the market has fully priced in a 25 basis point rate hike in December, with a 13% probability for a 50 basis point hike. On Wednesday, the US Treasury spot market was closed, but Treasury futures continued to fall, with corresponding yields rising by about 2 to 4 basis points, and spot gold came under pressure, dropping by 1.1%.

No Need to Worry About the Cooling Down of AI Data Center Construction? The US Import Boom Is Unlikely to Subside in the Short Term, Real Impact May Come in 2029
It takes an average of 4.8 years from finalizing investment to starting construction of a data center project, and an additional 2.6 years from construction start to becoming operational. Servers usually cannot be installed until after the building structure and racks are completed. For trade partners such as Taiwan (China), South Korea, and Mexico who rely on US data center supply chain demand, the inertia in construction timelines provides at least a one- to two-year buffer for future exports.

Federal Reserve Major Debate: When Should the Tenure of “Number Three” Williams End?
The main point of contention is whether Williams should step down in June 2028, upon completing a full 10-year term, or in June 2027, when he reaches the mandatory retirement age of 65. Analysts point out that the Federal Reserve Board holds ultimate discretion; if he leaves early, Fed Chair Waller would be able to assert greater control over the appointment to this critical position. However, forcing Williams to shorten his term could easily be interpreted as political manipulation. Williams himself is expected to serve until June 2028.

Crypto prices
More


