Bitget App
Trade smarter
Buy cryptoMarketsTradeFuturesStocksEarnInstitutionAI & More
Hyperliquid (HYPE) To Decline Further? Key Bearish Fractal Signaling Potential Downside Move

Hyperliquid (HYPE) To Decline Further? Key Bearish Fractal Signaling Potential Downside Move

CoinsProbeCoinsProbe2025/10/16 14:27
By:Nilesh Hembade

Date: Thu, Oct 16, 2025 | 08:30 AM GMT

The cryptocurrency market is still struggling to stage a meaningful V-shaped recovery following the October 10 crash, which triggered more than $19 billion in liquidations . The sharp decline dragged several altcoins lower by 20–30%, pushing many back to price levels not seen in months.

Among those hit is Hyperliquid (HYPE), which continues to trade in the red this week with a 16% weekly decline. But beyond the short-term price action, the technical structure is now flashing potential warning signs that could hint at a deeper correction ahead.

Hyperliquid (HYPE) To Decline Further? Key Bearish Fractal Signaling Potential Downside Move image 0 Source: Coinmarketcap

Fractal Setup Hints at Downside

A recent fractal comparison suggests that HYPE’s current market structure mirrors the 2019 cycle of Binance Coin (BNB) — a pattern that ended with a sharp correction.

In the case of BNB, the token rallied over 800% before facing heavy resistance near the 1.618–2.0 Fibonacci extension zone. Once it lost momentum and broke below the 100-day and 200-day moving averages, the price plunged over 73%, confirming a major trend reversal.
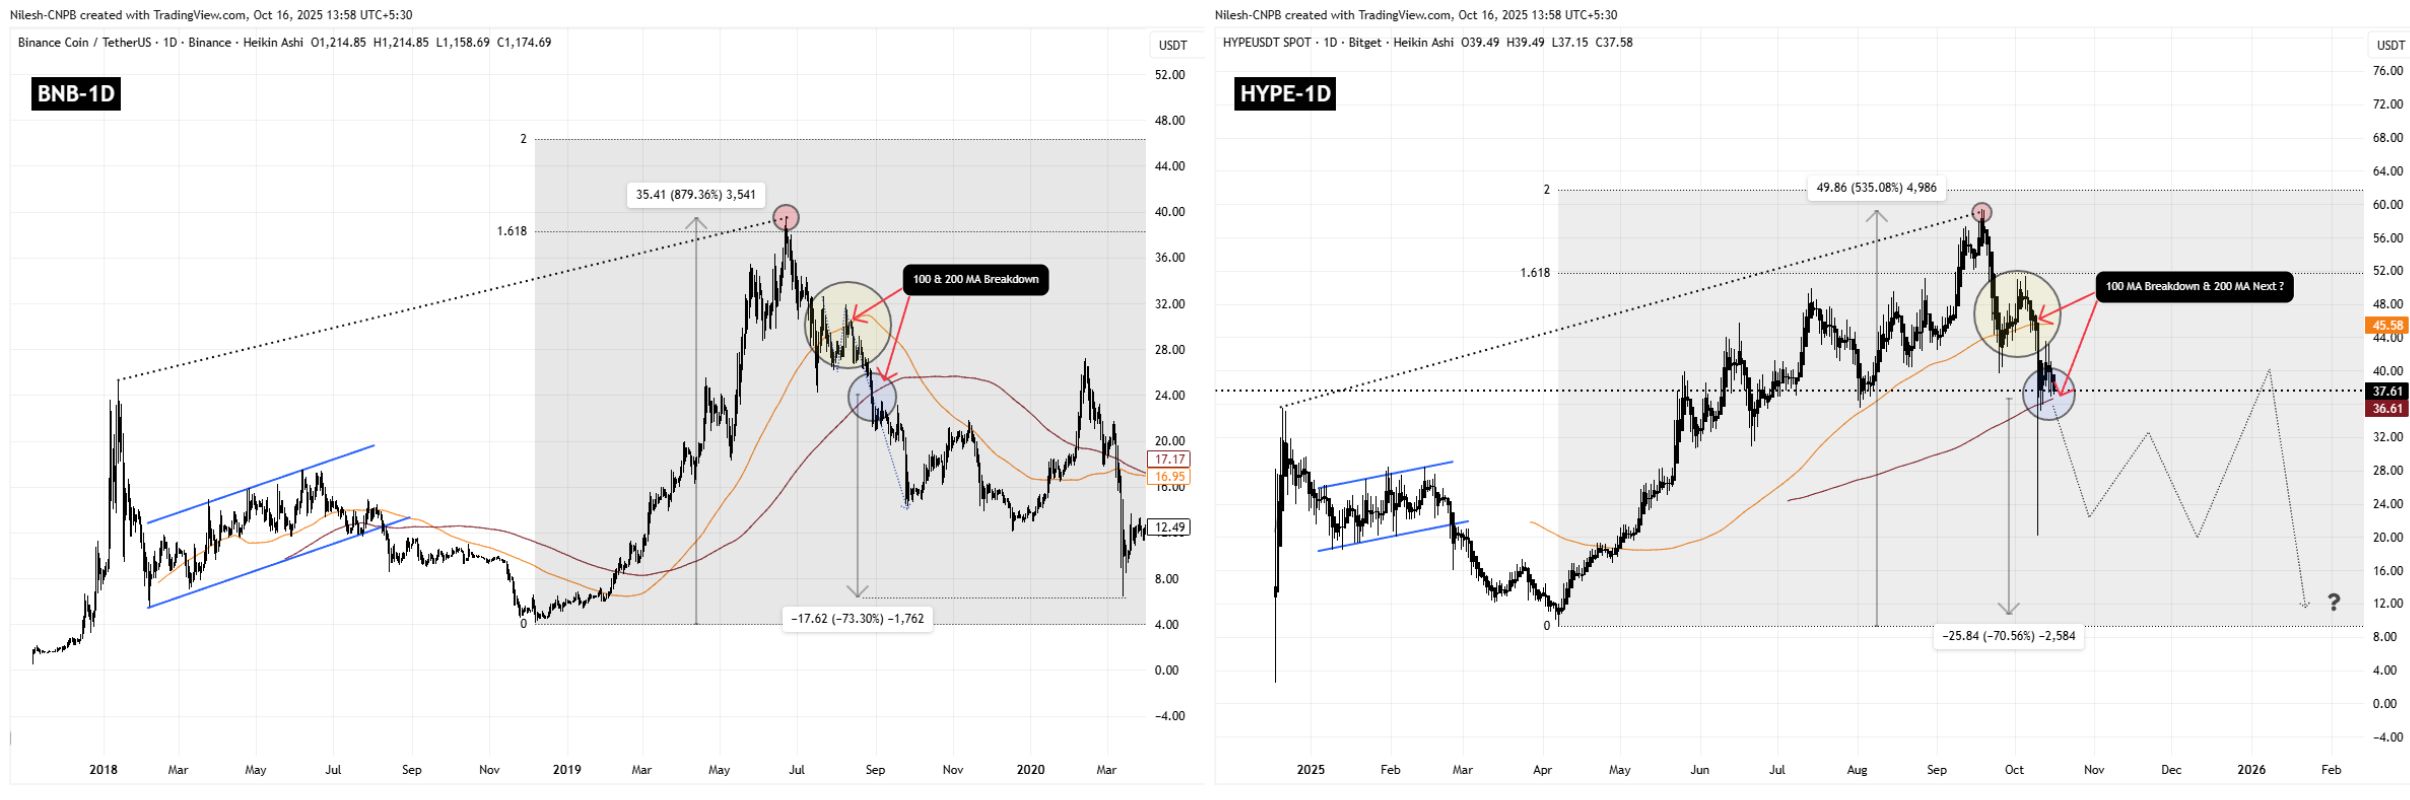
Hyperliquid (HYPE) To Decline Further? Key Bearish Fractal Signaling Potential Downside Move image 1 BNB and HYPE Fractal Chart/Coinsprobe (Source: Tradingview)

Fast-forward to 2025, HYPE appears to be tracing a similar path. After a strong 500% rally, the token began to correct from the same 1.618–2.0 Fibonacci extension area, suggesting an overextended move.

Currently, HYPE has already lost its 100-day moving average, which sits around $45.58, and is now trading near $37.88 — just above the 200-day moving average at $36.61, a level that served as the last line of defense in BNB’s prior fractal before its sharp decline.

What to Watch for HYPE?

If this bearish fractal continues to unfold, a breakdown below the 200-day MA could confirm the next leg down, potentially initiating a broader correction phase similar to what BNB experienced in 2019.

However, if HYPE manages to reclaim the 100-day MA at $45.58, it could invalidate the bearish setup and reintroduce bullish momentum. Such a move would signal renewed buying interest and suggest that the current pullback might be a consolidation rather than the start of a larger downtrend.

Traders should also remember that fractal patterns are not guaranteed — they merely provide a visual framework for potential price behavior based on historical similarities.


0
0

Disclaimer: The content of this article solely reflects the author's opinion and does not represent the platform in any capacity. This article is not intended to serve as a reference for making investment decisions.

Understand the market, then trade.
Bitget offers one-stop trading for cryptocurrencies, stocks, and gold.
Trade now!

You may also like

Wall Street giants collectively raise rate hike forecasts, US Treasury futures continue to fall, gold drops over 1% to break 4000

After the US October CPI exceeded expectations, Goldman Sachs and Nomura added a forecast for an interest rate hike in March next year, while Deutsche Bank included a forecast for a rate hike in January next year. Currently, the market has fully priced in a 25 basis point rate hike in December, with a 13% probability for a 50 basis point hike. On Wednesday, the US Treasury spot market was closed, but Treasury futures continued to fall, with corresponding yields rising by about 2 to 4 basis points, and spot gold came under pressure, dropping by 1.1%.

华尔街见闻•2026/11/11 21:18
Wall Street giants collectively raise rate hike forecasts, US Treasury futures continue to fall, gold drops over 1% to break 4000

No Need to Worry About the Cooling Down of AI Data Center Construction? The US Import Boom Is Unlikely to Subside in the Short Term, Real Impact May Come in 2029

It takes an average of 4.8 years from finalizing investment to starting construction of a data center project, and an additional 2.6 years from construction start to becoming operational. Servers usually cannot be installed until after the building structure and racks are completed. For trade partners such as Taiwan (China), South Korea, and Mexico who rely on US data center supply chain demand, the inertia in construction timelines provides at least a one- to two-year buffer for future exports.

华尔街见闻•2026/11/11 21:18
No Need to Worry About the Cooling Down of AI Data Center Construction? The US Import Boom Is Unlikely to Subside in the Short Term, Real Impact May Come in 2029

Federal Reserve Major Debate: When Should the Tenure of “Number Three” Williams End?

The main point of contention is whether Williams should step down in June 2028, upon completing a full 10-year term, or in June 2027, when he reaches the mandatory retirement age of 65. Analysts point out that the Federal Reserve Board holds ultimate discretion; if he leaves early, Fed Chair Waller would be able to assert greater control over the appointment to this critical position. However, forcing Williams to shorten his term could easily be interpreted as political manipulation. Williams himself is expected to serve until June 2028.

华尔街见闻•2026/11/11 21:18
Federal Reserve Major Debate: When Should the Tenure of “Number Three” Williams End?

