
Ethereum in Retreat Mode as Institutions Dump Record Holdings

Ethereum remains under pressure after record ETF outflows erased $428 million in capital. With sentiment turning bearish, ETH risks extending its dip unless new demand reignites momentum.
Ethereum’s market sentiment continues to struggle following last Friday’s market crash, despite gradual signs of broader market improvement.
As institutional investors reduce participation, spot market participants have also trimmed their holdings. This could result in continued consolidation or a definitive breakdown of the critical $4,000 resistance level around which the coin currently trades.
Ethereum Market Hits Pause Amid Record ETF Redemptions
ETH-backed exchange-traded funds (ETFs) have recorded significant outflows since last Friday’s market-wide liquidation event. According to data from SosoValue, these funds registered $428.52 million in outflows on Monday.
For token TA and market updates: Want more token insights like this? Sign up for Editor Harsh Notariya’s Daily Crypto Newsletter .
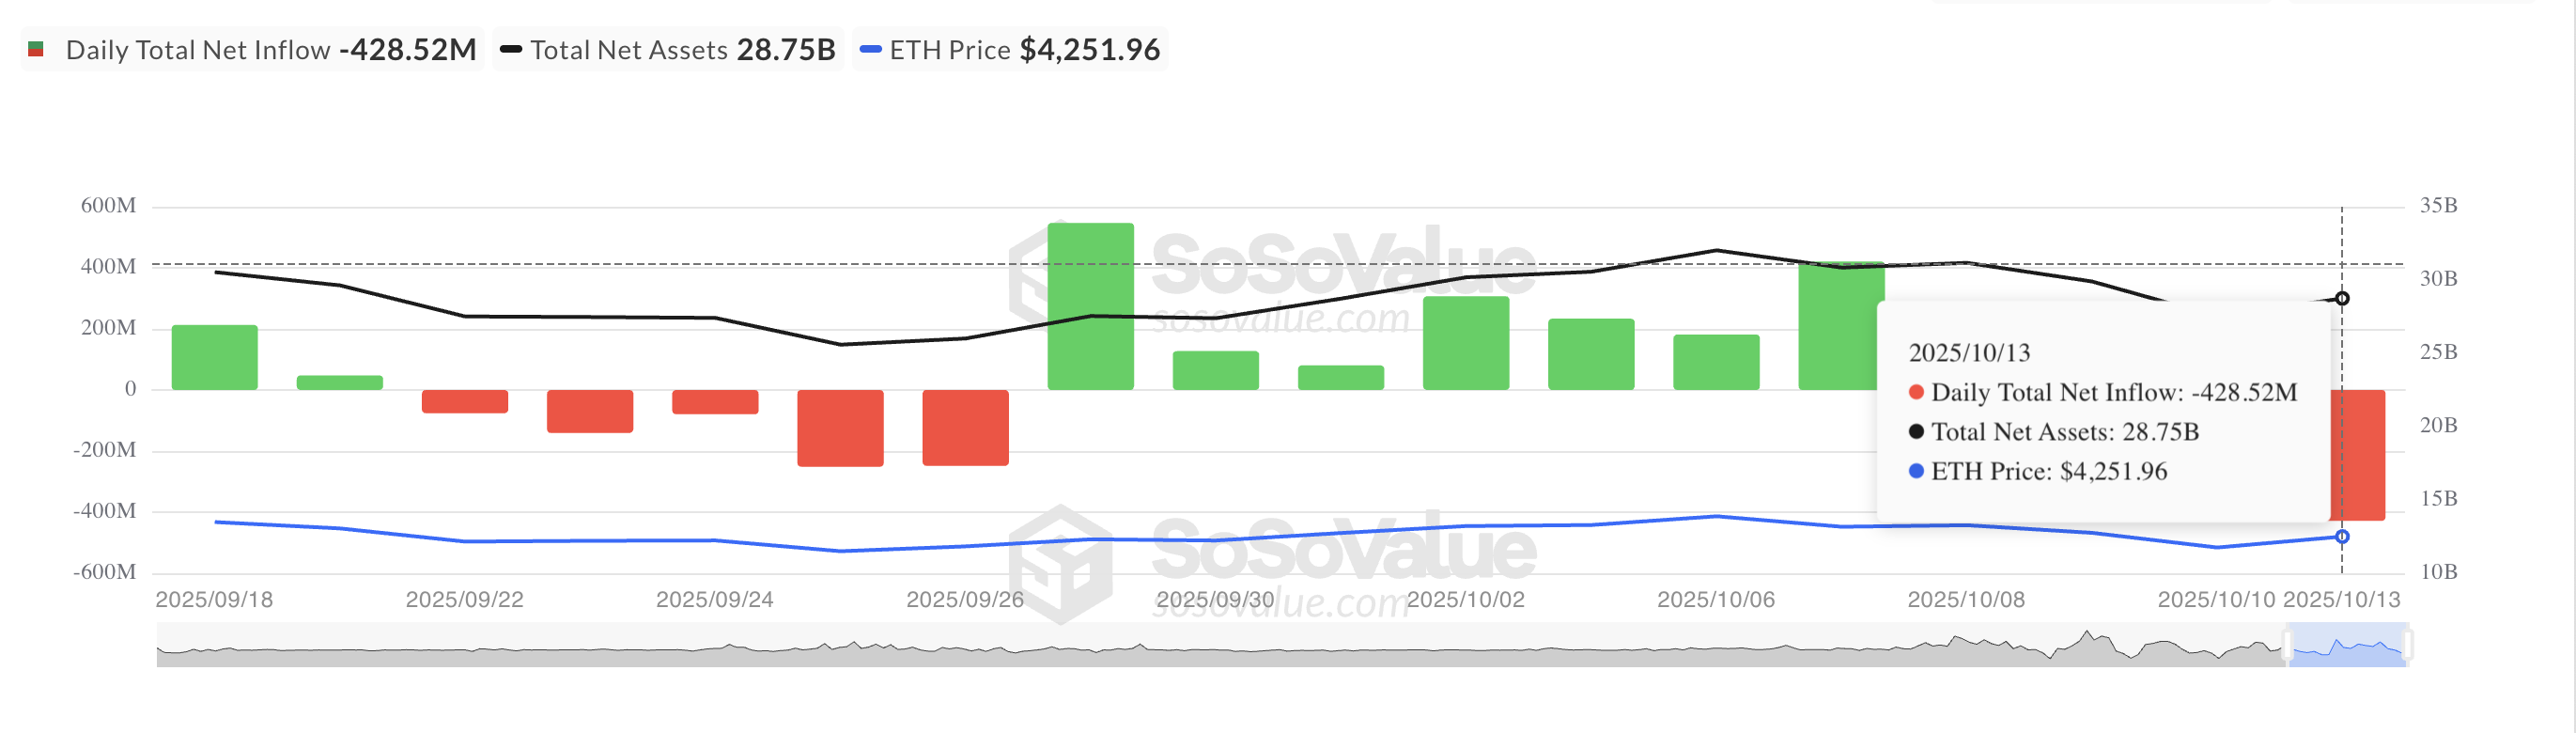 Total Ethereum Spot ETF Netflow. Source:
SosoValue
BlackRock’s iShares Ethereum Trust (ETHA) led ETF outflows with $310.13 million in redemptions, followed by Grayscale’s Ethereum Trust (ETHE) at $20.99 million and Fidelity’s Ethereum Fund (FETH) at $19.12 million.
Bitwise’s Ethereum ETF (ETHW) and VanEck’s Ethereum ETF (ETHV) recorded smaller declines of $12.18 million and $9.34 million, respectively, on the same day.
According to the data provider, Monday’s outflows marked the largest single-day capital exit from these funds since August 4, highlighting the decline in institutional interest following the liquidation event.
This trend may further dampen market sentiment around the altcoin and add more downward pressure on its price, limiting the coin’s ability to recover in the short term.
Bearish Signals Mount for Ethereum Amid Technical Weakness
Readings from the ETH/USD daily chart show the altcoin trading below its Super Trend indicator, which now acts as dynamic resistance at $4,561. For context, ETH is currently trading well below this level, at $3,986.
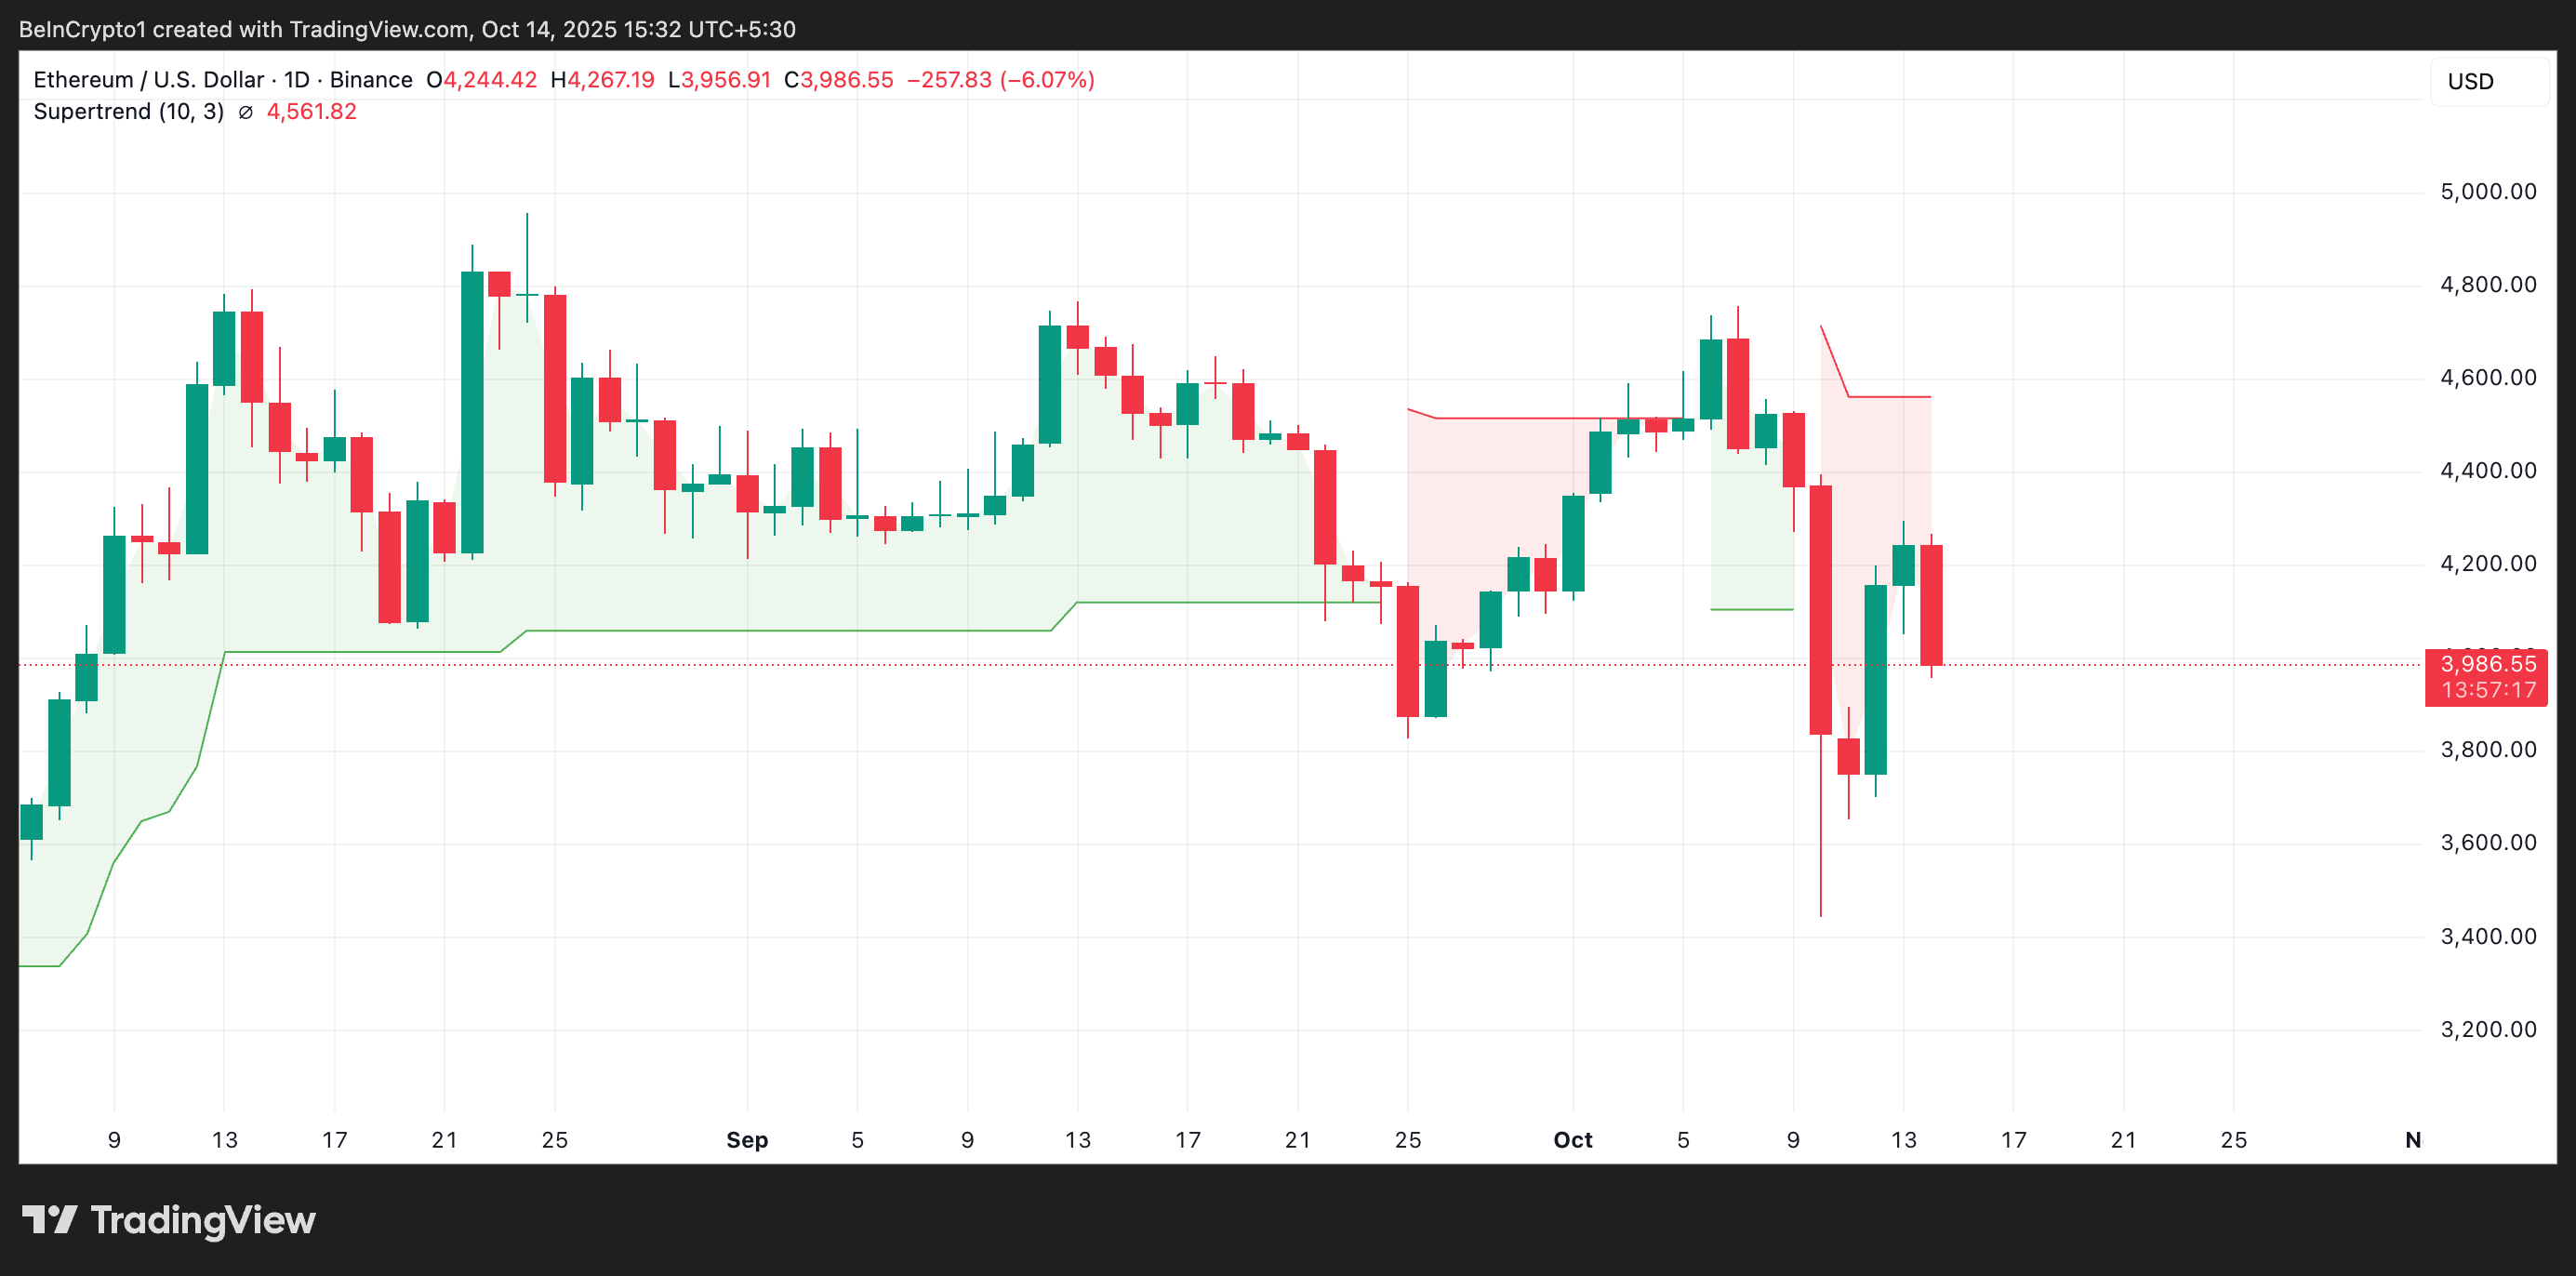 ETH Super Trend Indicator. Source:
TradingView
The Super Trend indicator helps traders identify the market’s direction by placing a line above or below the price chart based on the asset’s volatility.
When an asset’s price trades above the Super Trend line, it signals a bullish trend, indicating that the market is in an uptrend and buying pressure is dominant.
Conversely, as with ETH, when an asset trades below this line, it signals that the market is under bearish control. Traders usually interpret a position below the Super Trend as a warning that downward momentum could continue, making it harder for ETH to regain strength in the near term.
Bears Target Lower Levels While Buyers Wait
If bullish sentiment remains elusive, ETH could extend its decline below the critical $4,000 price level, potentially dropping to $3,626. If this level weakens, it could give way to a deeper decline toward $3,215.
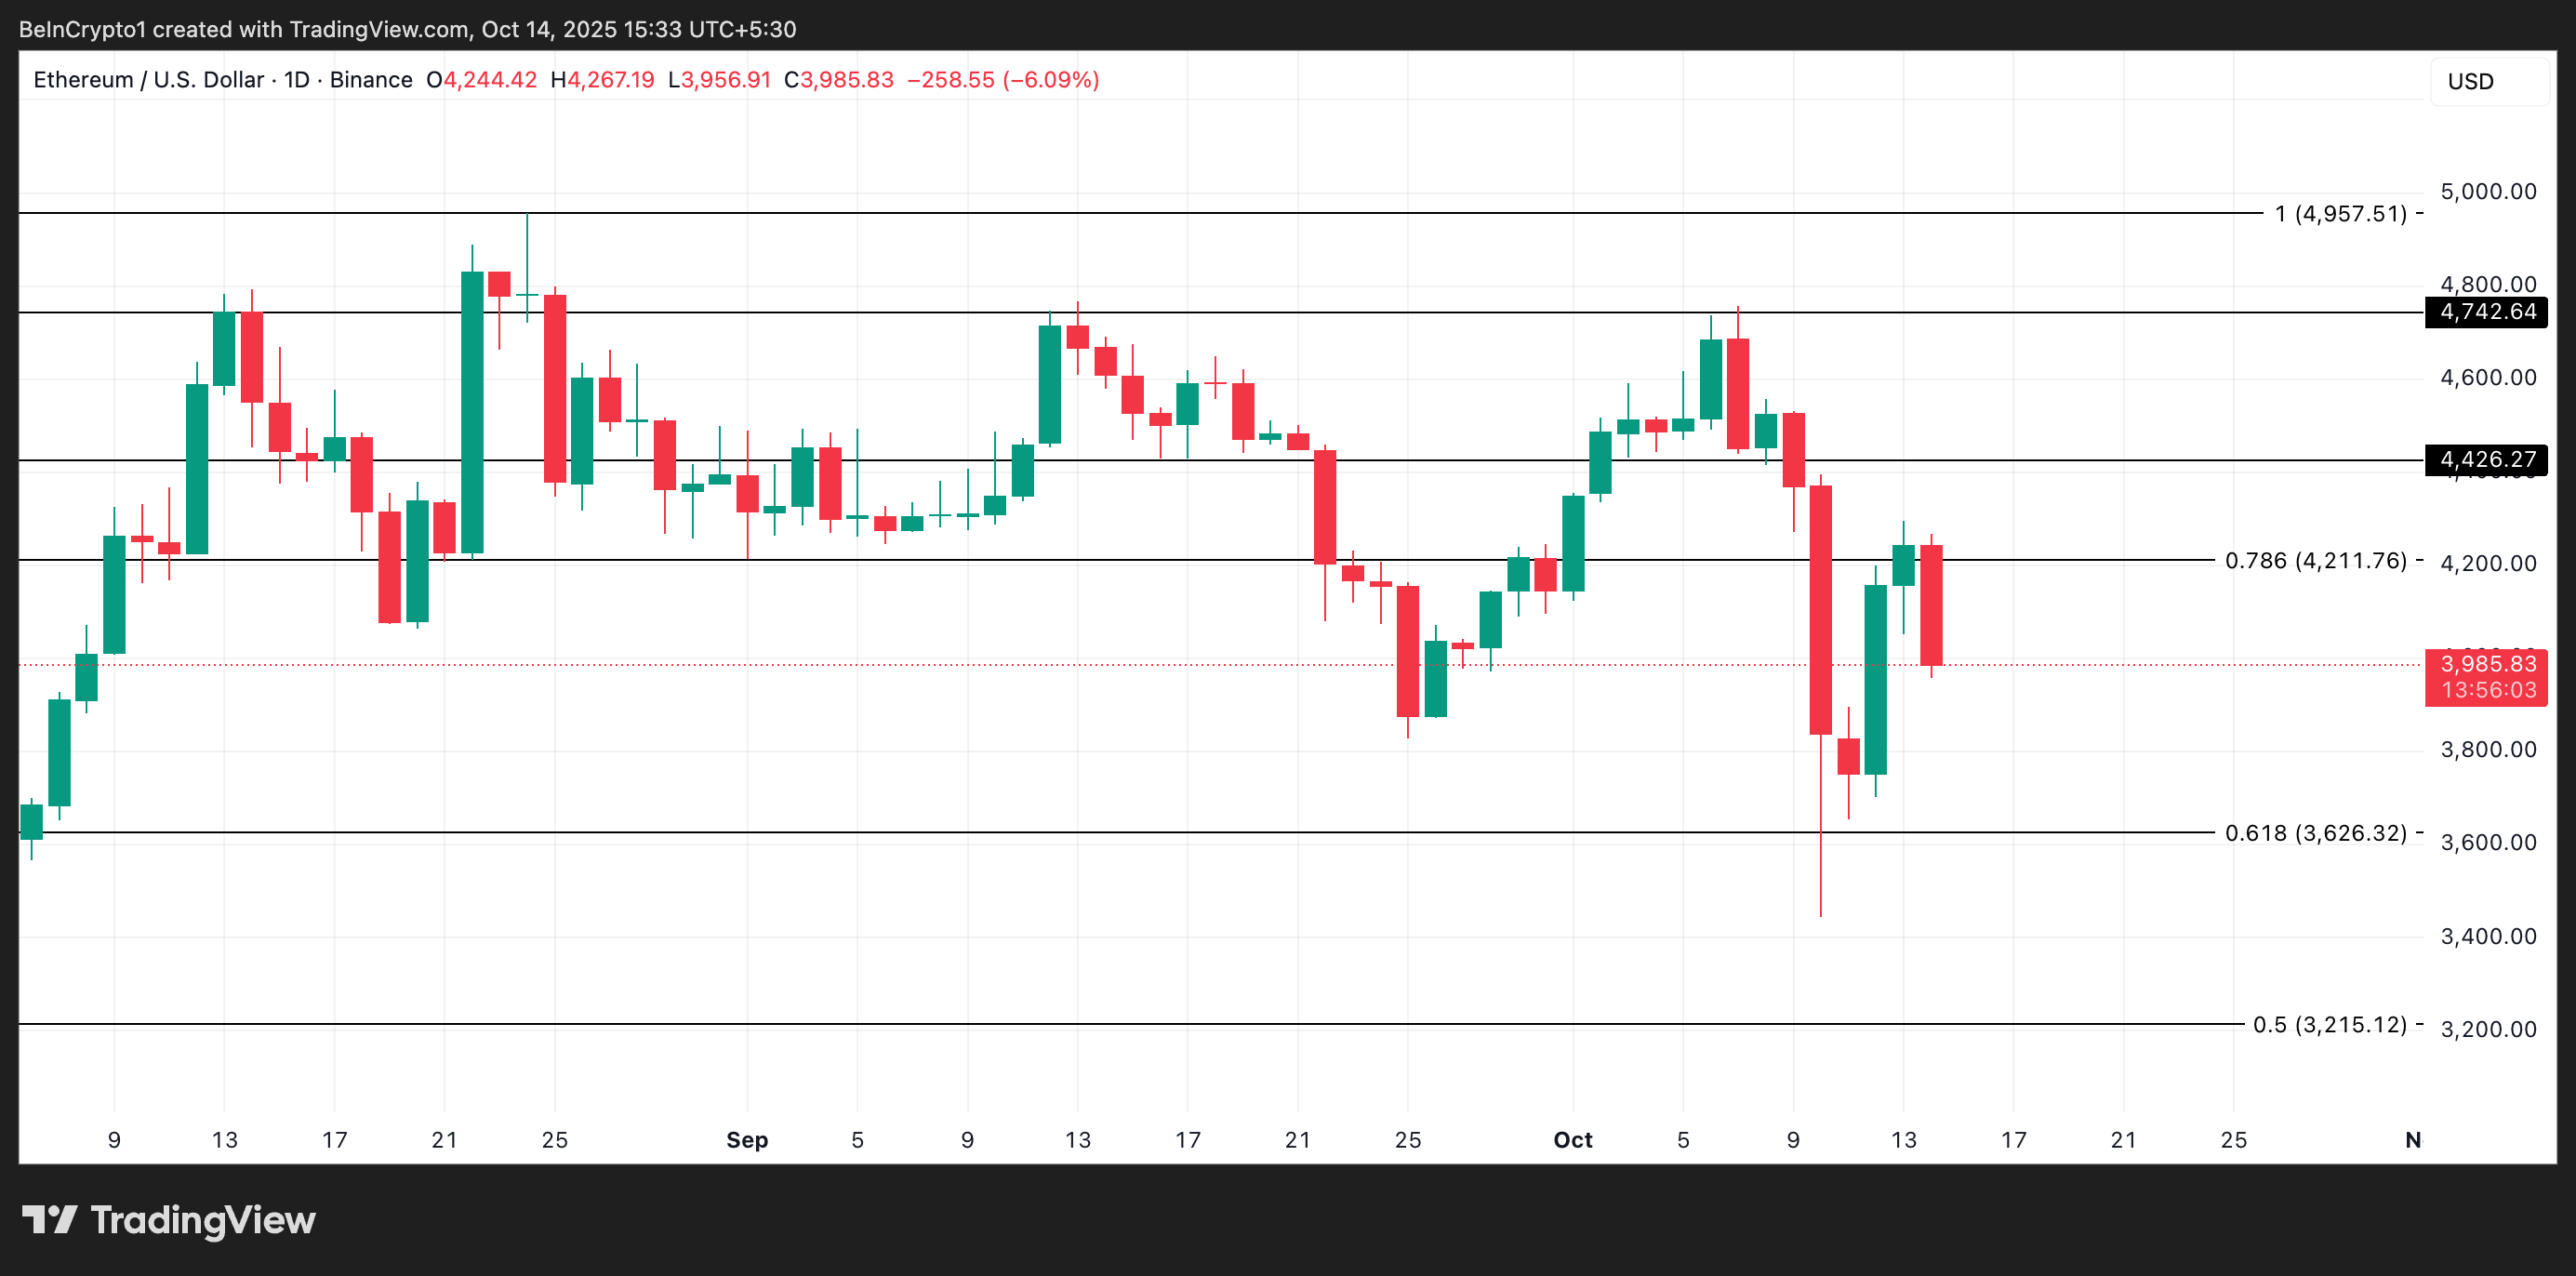 ETH Price Analysis. Source:
TradingView
However, a rebound in new demand for the leading altcoin could invalidate this bearish outlook. In that scenario, the coin’s price could climb to $4,211.
Disclaimer: The content of this article solely reflects the author's opinion and does not represent the platform in any capacity. This article is not intended to serve as a reference for making investment decisions.
You may also like

Wall Street giants collectively raise rate hike forecasts, US Treasury futures continue to fall, gold drops over 1% to break 4000
After the US October CPI exceeded expectations, Goldman Sachs and Nomura added a forecast for an interest rate hike in March next year, while Deutsche Bank included a forecast for a rate hike in January next year. Currently, the market has fully priced in a 25 basis point rate hike in December, with a 13% probability for a 50 basis point hike. On Wednesday, the US Treasury spot market was closed, but Treasury futures continued to fall, with corresponding yields rising by about 2 to 4 basis points, and spot gold came under pressure, dropping by 1.1%.

No Need to Worry About the Cooling Down of AI Data Center Construction? The US Import Boom Is Unlikely to Subside in the Short Term, Real Impact May Come in 2029
It takes an average of 4.8 years from finalizing investment to starting construction of a data center project, and an additional 2.6 years from construction start to becoming operational. Servers usually cannot be installed until after the building structure and racks are completed. For trade partners such as Taiwan (China), South Korea, and Mexico who rely on US data center supply chain demand, the inertia in construction timelines provides at least a one- to two-year buffer for future exports.

Federal Reserve Major Debate: When Should the Tenure of “Number Three” Williams End?
The main point of contention is whether Williams should step down in June 2028, upon completing a full 10-year term, or in June 2027, when he reaches the mandatory retirement age of 65. Analysts point out that the Federal Reserve Board holds ultimate discretion; if he leaves early, Fed Chair Waller would be able to assert greater control over the appointment to this critical position. However, forcing Williams to shorten his term could easily be interpreted as political manipulation. Williams himself is expected to serve until June 2028.

Crypto prices
More


