
Deeper Cardano (ADA) Price Dip Likely as Double “Death” Crossovers Loom

Cardano’s strong three-month run faces a short-term test. The ADA price has broken below a key pattern while whales trim holdings and two death crossovers form on the 4-hour chart — hinting that a dip to $0.76 could be next.
Cardano’s (ADA’s) short-term momentum looks shaky. The Cardano price has corrected by more than 5% in the past 24 hours, breaking down from a bearish chart pattern.
Despite this drop, the bigger picture still shows strength — ADA remains up 31% over the past three months. But the recent technical and on-chain signals suggest that the current phase may bring more downside before another push higher.
Whale Outflows Align With Looming Double Death Crossovers
On-chain data shows a quiet shift in whale behavior. Wallets holding between 10 million and 100 million ADA have reduced their holdings from 13.09 billion to 13.07 billion tokens since Oct 6. That’s a net drop of roughly 20 million ADA, worth about $16 million at current prices.
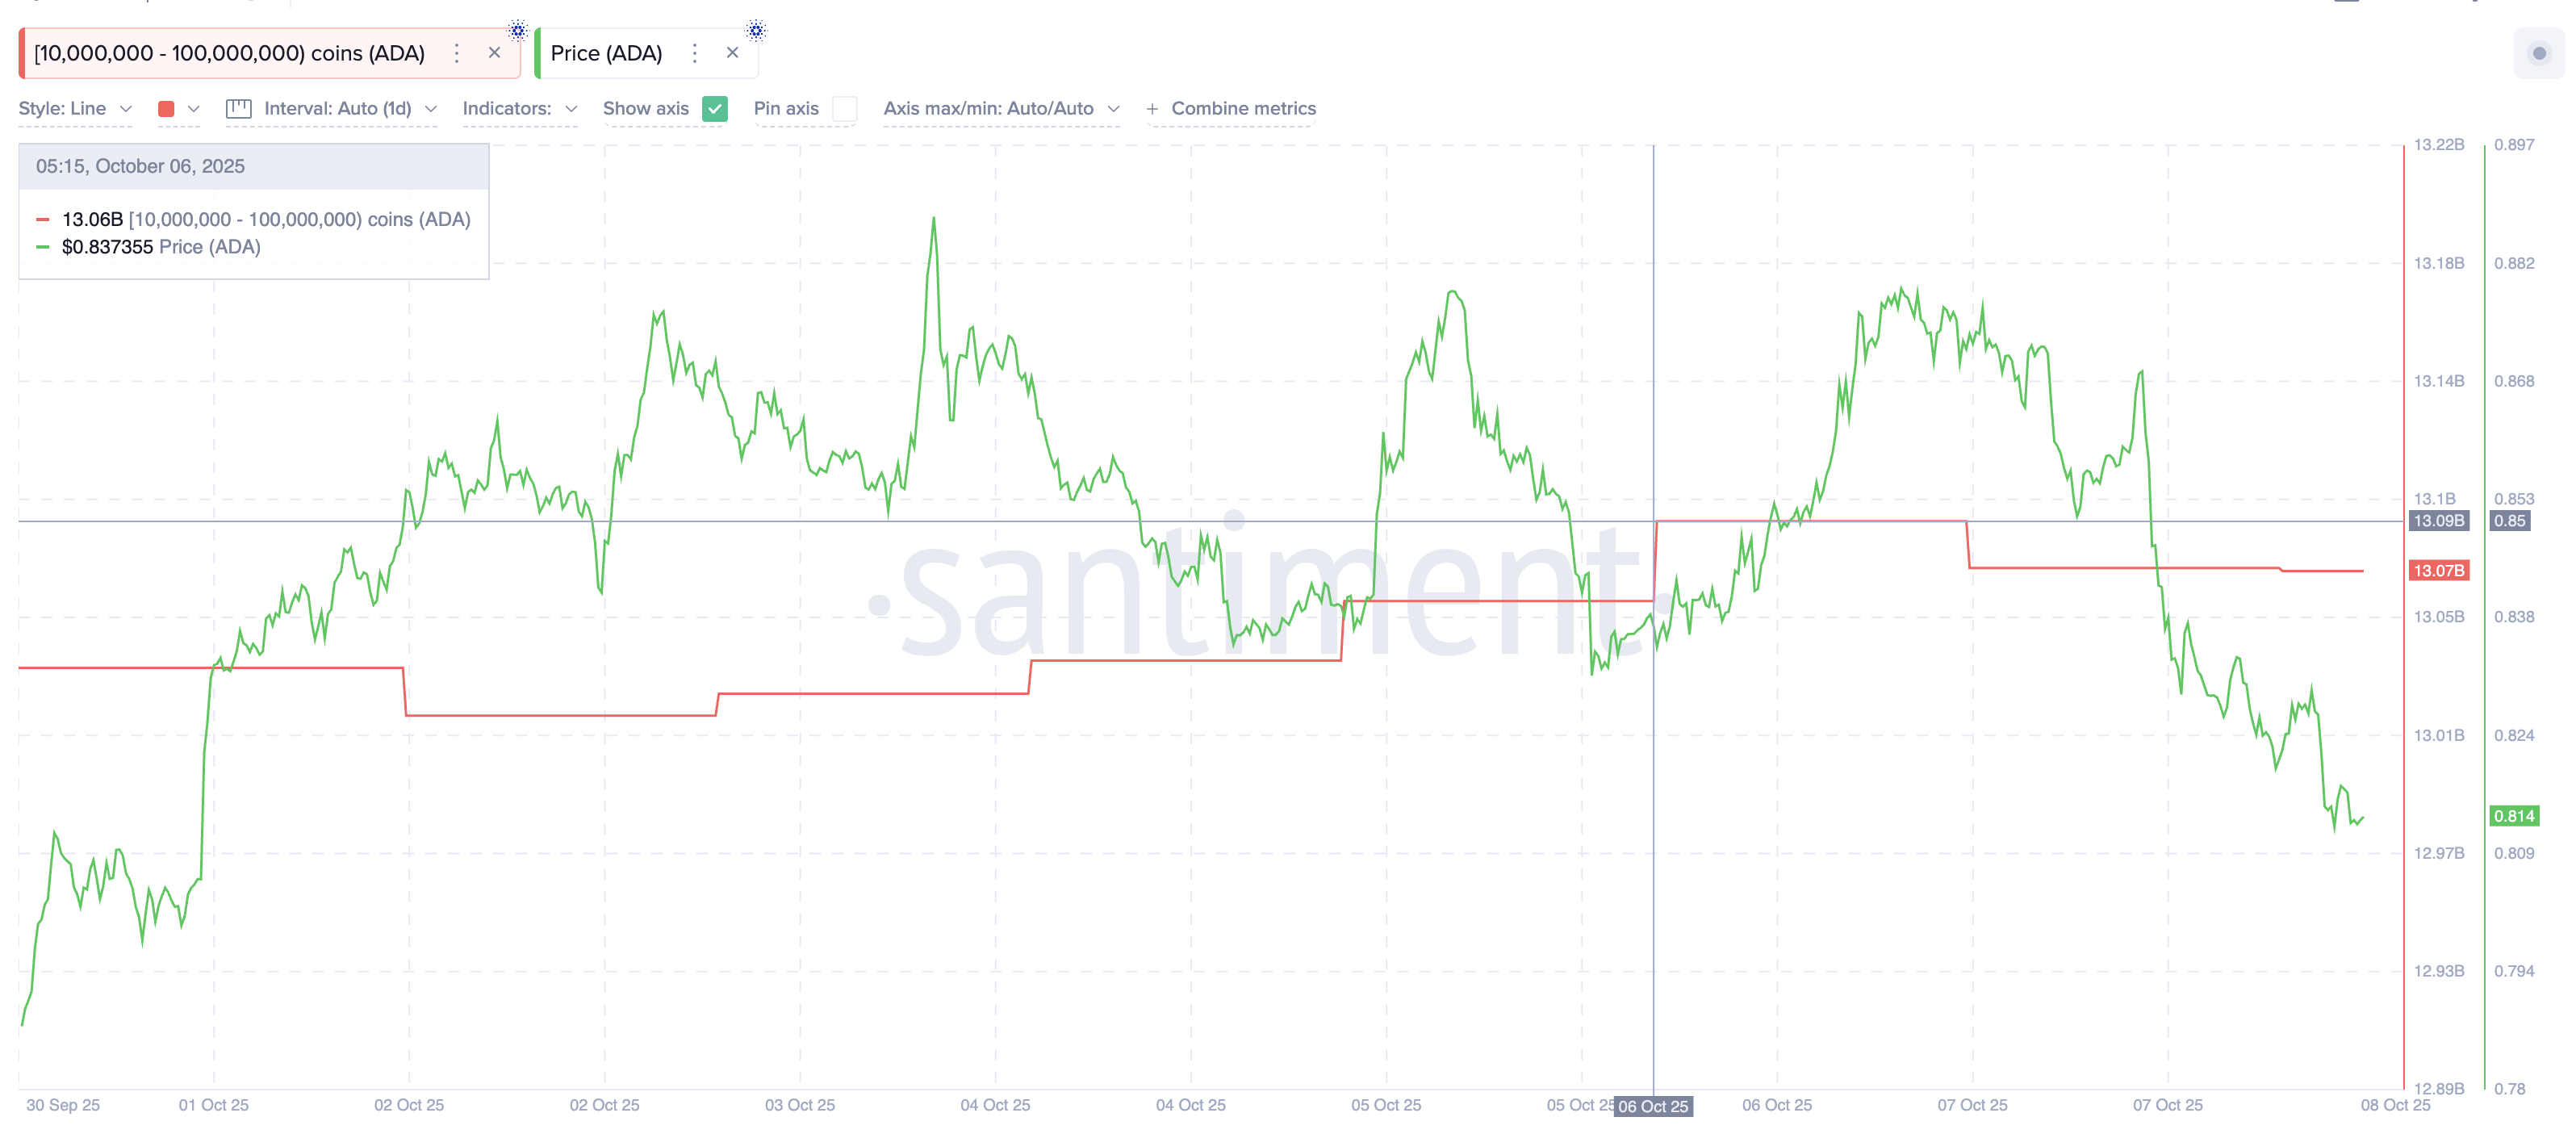 Cardano Whale Outflows:
Santiment
Even though the change seems small, it often signals growing caution among larger investors — especially when paired with technical weakness.
Want more token insights like this? Sign up for Editor Harsh Notariya’s Daily Crypto Newsletter
On the 4-hour chart, ADA’s moving averages are flashing early warning signs. The Exponential Moving Average (EMA) is a tool that smooths price data to highlight trend direction. The shorter-term 20-period EMA (red line) has now started sliding below both the 50-period (orange line) and 200-period EMAs (deep blue line), forming what traders call a “Death Crossover.”
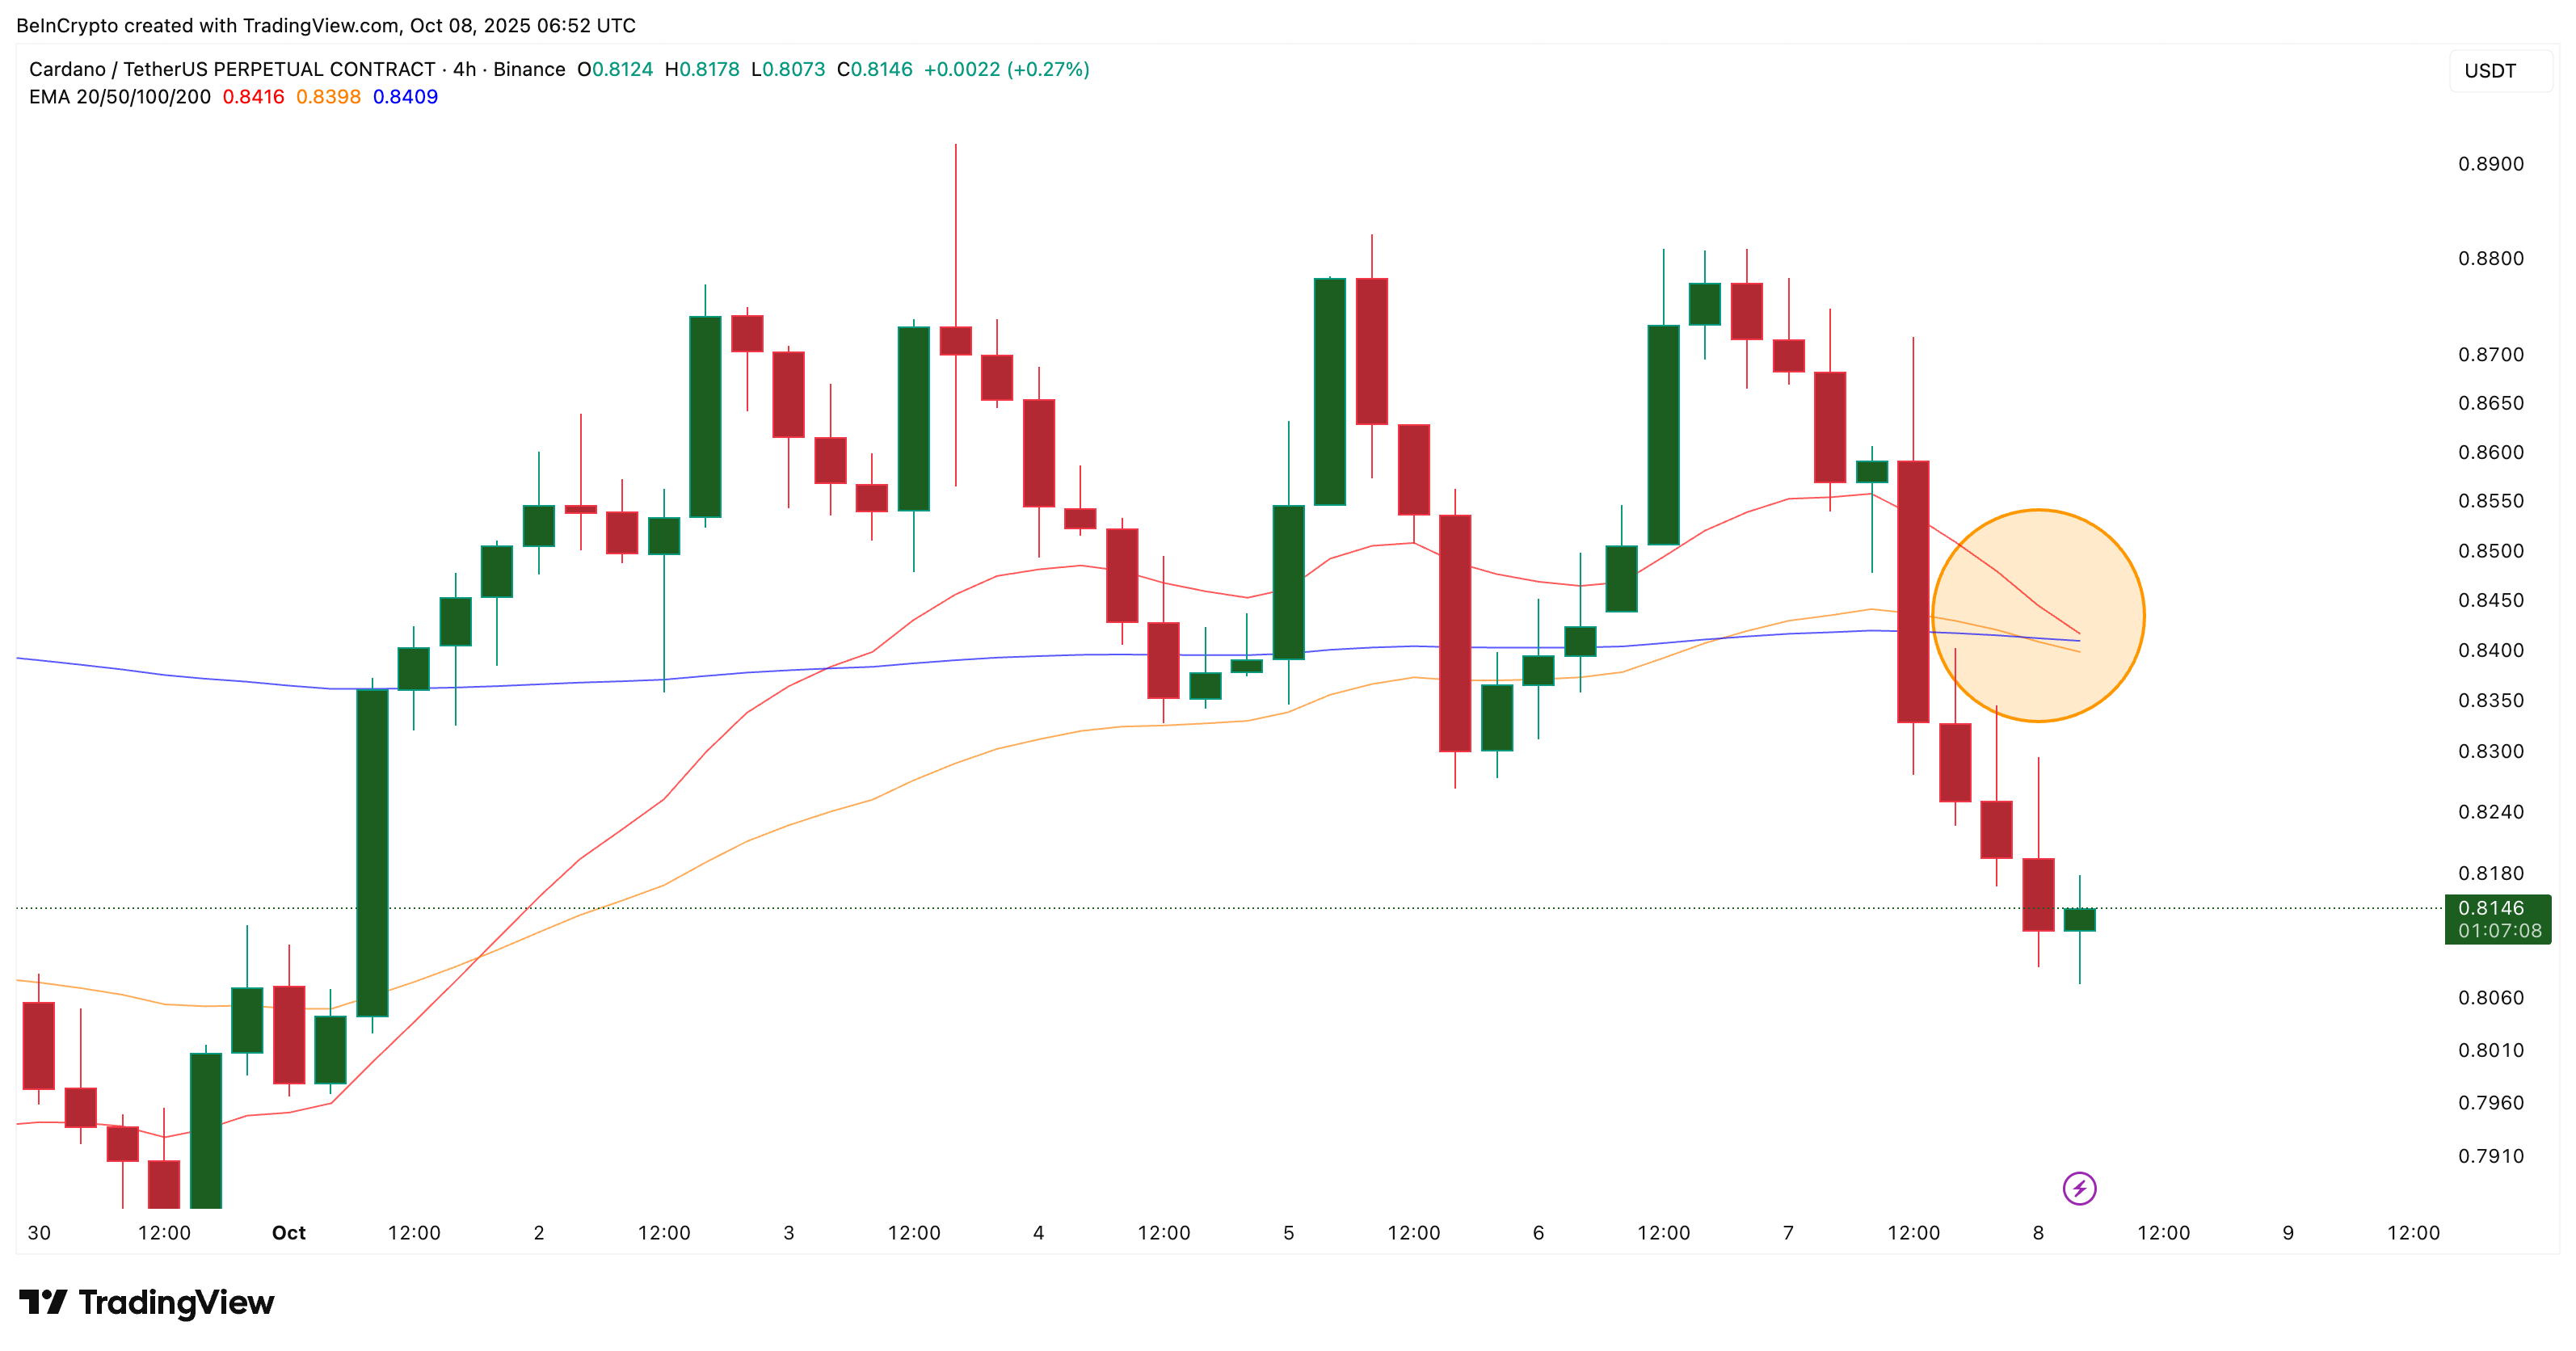 Looming ADA Death Crossovers:
TradingView
This pattern often signals that sellers are gaining control as short-term momentum fades. In ADA’s case, two such crossovers — or a double death crossover — are forming, showing mounting downside pressure.
When this type of bearish crossover aligns with whale outflows, it usually suggests that large investors are taking a defensive stance ahead of possible volatility.
Together, the whale trimming and bearish EMA setup strengthen the case for a short-term correction, even though the broader Cardano (ADA) price trend still looks positive.
Bearish Pattern Hints at $0.76 Cardano Price Target
The 4-hour chart also shows ADA trading inside a descending channel, a pattern marked by lower highs and lower lows. This pattern often forms during correction phases, indicating that sellers are still active.
Based on the measured move from the channel’s breakdown point, the Cardano price target sits near $0.76, which acts as a major support zone. That would mean another 6% correction from the current ADA price levels. However, before falling that deep, the ADA price might find support at $0.78, provided whales get back to accumulating.
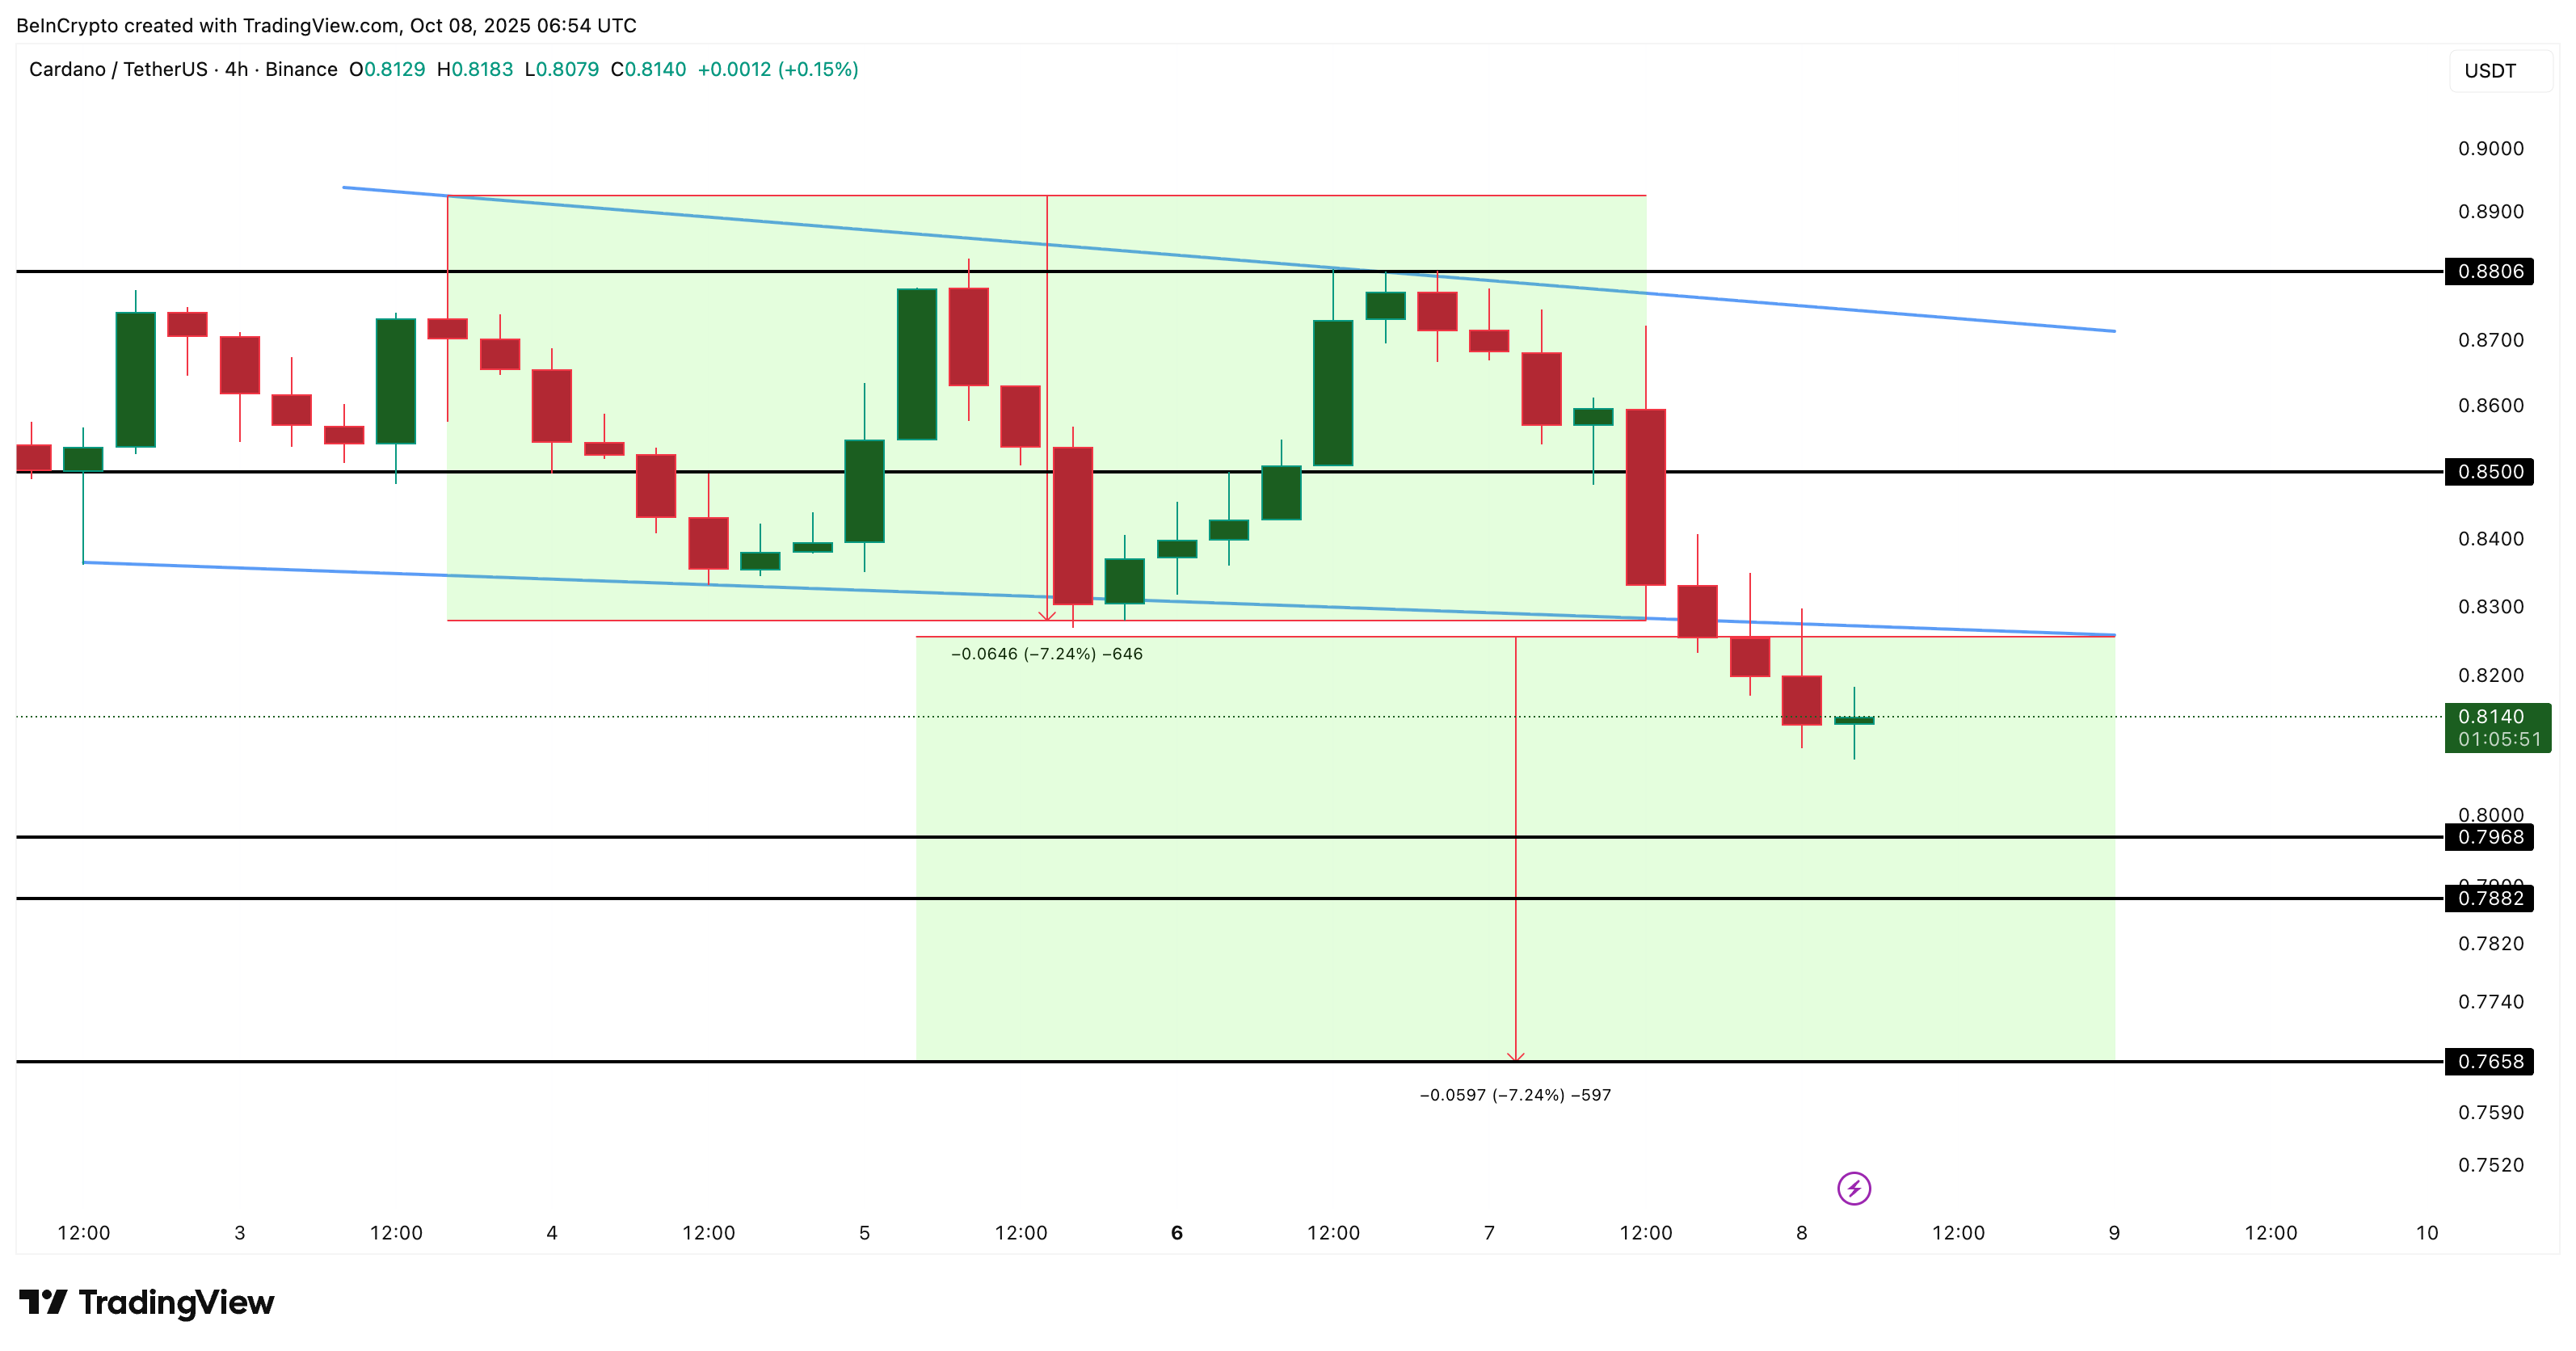 Cardano Price Analysis:
TradingView
However, if the Cardano price manages a strong 4-hour candle close above $0.85, followed by a move past $0.88, the bearish setup would be invalidated — potentially marking the end of the correction phase.
Until that happens, traders may see ADA’s dip toward $0.76 as a temporary cooldown rather than a full reversal.
Disclaimer: The content of this article solely reflects the author's opinion and does not represent the platform in any capacity. This article is not intended to serve as a reference for making investment decisions.
You may also like

Wall Street giants collectively raise rate hike forecasts, US Treasury futures continue to fall, gold drops over 1% to break 4000
After the US October CPI exceeded expectations, Goldman Sachs and Nomura added a forecast for an interest rate hike in March next year, while Deutsche Bank included a forecast for a rate hike in January next year. Currently, the market has fully priced in a 25 basis point rate hike in December, with a 13% probability for a 50 basis point hike. On Wednesday, the US Treasury spot market was closed, but Treasury futures continued to fall, with corresponding yields rising by about 2 to 4 basis points, and spot gold came under pressure, dropping by 1.1%.

No Need to Worry About the Cooling Down of AI Data Center Construction? The US Import Boom Is Unlikely to Subside in the Short Term, Real Impact May Come in 2029
It takes an average of 4.8 years from finalizing investment to starting construction of a data center project, and an additional 2.6 years from construction start to becoming operational. Servers usually cannot be installed until after the building structure and racks are completed. For trade partners such as Taiwan (China), South Korea, and Mexico who rely on US data center supply chain demand, the inertia in construction timelines provides at least a one- to two-year buffer for future exports.

Federal Reserve Major Debate: When Should the Tenure of “Number Three” Williams End?
The main point of contention is whether Williams should step down in June 2028, upon completing a full 10-year term, or in June 2027, when he reaches the mandatory retirement age of 65. Analysts point out that the Federal Reserve Board holds ultimate discretion; if he leaves early, Fed Chair Waller would be able to assert greater control over the appointment to this critical position. However, forcing Williams to shorten his term could easily be interpreted as political manipulation. Williams himself is expected to serve until June 2028.

Crypto prices
More


