

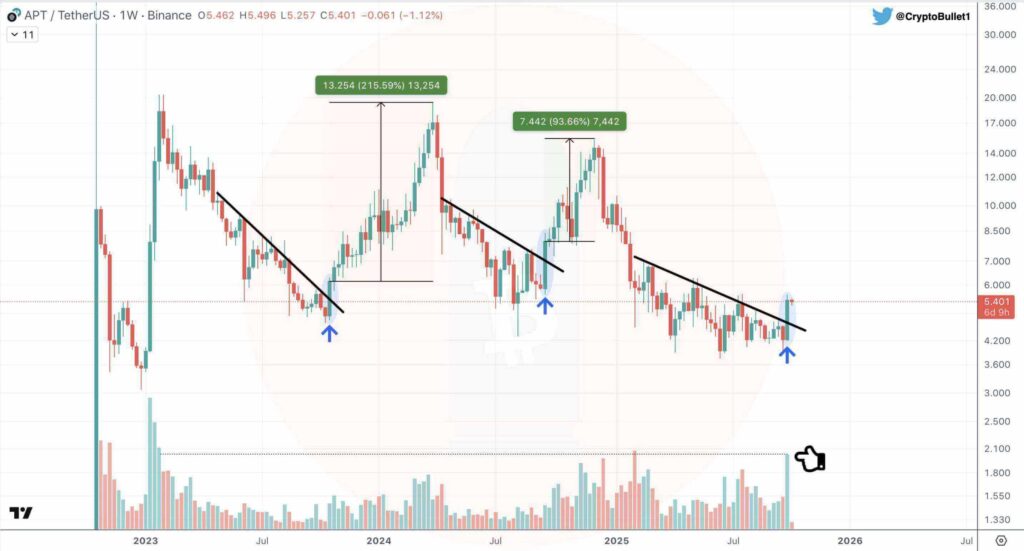
Aptos (APT) has broken above its long-term descending trendline with the strongest weekly green volume since January 2023, confirming renewed bullish momentum and targeting resistance between $7.00 and $7.50 while holding key support near $5.00.
-
Aptos has cleared a long-term descending trendline, mirroring past breakout structures that preceded major rallies.
-
Weekly volume is the largest since January 2023, signaling stronger buying pressure and increased market participation.
-
Short-term targets: $7.00–$7.50 resistance; crucial support sits near $5.00 with a deeper pivot around $4.00–$4.20.
Aptos breakout: APT above trendline with highest weekly green volume since 2023 — monitor $7.00–$7.50 resistance and $5.00 support for next moves. Read on for targets.
Aptos breaks above its long term trendline with the strongest trading volume since 2023, repeating its historical rally pattern.
- Aptos has broken above its descending trendline, replicating past breakout structures that led to major rallies.
- Analyst CryptoBullet notes this breakout comes with the largest green volume since January 2023, boosting market strength.
- APT targets resistance between $7.00 and $7.50, with sustained momentum likely keeping price above the $5.00 support zone.
Aptos (APT) has had another notable breakout above its long-term descending trendline, repeating a familiar historical setup. According to analyst CryptoBullet, the weekly candle shows a strong breakout similar to previous moves that preceded substantial rallies. The latest surge also came with the highest green volume since January 2023, highlighting renewed market participation and stronger buying activity.
What is the historical pattern behind Aptos breakouts?
The Aptos breakout pattern is a recurring technical setup where a decisive weekly close above a long-term descending trendline precedes multi-week rallies. Historical examples include early 2023 (roughly +215% from the breakout) and late 2023 (about +94%), demonstrating a repeatable breakout-to-rally sequence.
How significant is the recent volume expansion?
The weekly volume spike is the largest observed since January 2023, confirming accumulation pressure and validating the breakout. Higher volume on a breakout increases the probability of follow-through, as it shows liquidity and investor conviction rather than a thin-market false breakout.
 Source: CryptoBullet on X
Why does volume confirm the breakout?
Volume confirms a breakout when the move is accompanied by a clear increase in traded contracts or coins on the weekly chart. In Aptos’ case, the largest green weekly volume since January 2023 indicates that buyers outnumbered sellers decisively, reducing the likelihood of a short-lived false breakout.
When could Aptos reach the next resistance levels?
If momentum persists and weekly closes hold above the $5.00 breakout zone, Aptos may test the $7.00–$7.50 resistance range in coming weeks. A successful breach of that range could pave the way toward the $9.00 area, while failure to hold $5.00 risks a retest of $4.20–$4.00 support.
How should traders assess risk and targets?
Traders should use layered risk management: set stop-losses below the $5.00 breakout zone, scale into positions on clear weekly closes above key levels, and size exposure to account for volatility. Confirmations include sustained weekly volume above the breakout and absence of aggressive distribution patterns.
Frequently Asked Questions
What signals confirm a valid Aptos breakout?
Valid signals include a decisive weekly close above the descending trendline, the largest weekly green volume since January 2023, and subsequent weekly closes that keep price above the $5.00 breakout zone. These elements together reduce the risk of a false breakout.
How should investors approach trading APT now?
Use position sizing, place stop-losses below $5.00, and watch weekly volume and closes for confirmation. Consider scaling into positions after successive weekly confirmations rather than entering on a single impulsive candle.
Key Takeaways
- Breakout confirmed: Weekly close above the long-term trendline with high volume supports bullish momentum.
- Volume matters: Largest weekly green volume since January 2023 signals stronger buying conviction.
- Targets risk: Watch $7.00–$7.50 resistance and keep $5.00 as critical support; manage risk with stops and sizing.
Conclusion
In summary, the Aptos breakout combines a pattern repeat with meaningful volume expansion, increasing the probability of a sustained rally. Traders should monitor weekly closes and volume, target $7.00–$7.50 on the upside, and protect positions near $5.00. COINOTAG reports and expert commentary (CryptoBullet) support this technical view.






